$332,800
2 bd|2 ba|1.2k sqft
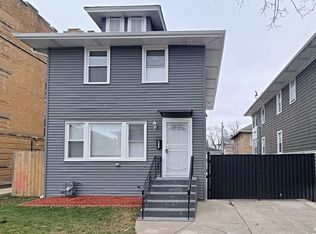
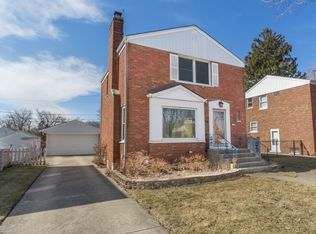
1112 Manchester Ave, Westchester, IL 60154
Off Market
Likely to sell faster than
Zillow last checked: 7 hours ago
Listing updated: April 01, 2026 at 07:52pm
Flemon Hope 773-637-6282,
Coldwell Banker Realty
$340,100
$323,000 - $357,000
$2,708/mo
| Date | Event | Price |
|---|---|---|
| 3/24/2026 | Listed for sale | $344,900+189.8%$284/sqft |
Source: | ||
| 9/25/2023 | Listing removed | -- |
Source: Zillow Rentals Report a problem | ||
| 8/21/2023 | Price change | $2,475-1%$2/sqft |
Source: Zillow Rentals Report a problem | ||
| 8/2/2023 | Price change | $2,500+4.2%$2/sqft |
Source: Zillow Rentals Report a problem | ||
| 7/10/2023 | Listed for rent | $2,400+6.7%$2/sqft |
Source: Zillow Rentals Report a problem | ||
| 4/11/2023 | Listing removed | -- |
Source: Zillow Rentals Report a problem | ||
| 3/29/2023 | Listed for rent | $2,250+12.5%$2/sqft |
Source: Zillow Rentals Report a problem | ||
| 2/24/2021 | Listing removed | -- |
Source: Owner Report a problem | ||
| 11/24/2020 | Listing removed | $2,000$2/sqft |
Source: Owner Report a problem | ||
| 10/26/2020 | Listed for rent | $2,000$2/sqft |
Source: Owner Report a problem | ||
| 10/10/2018 | Sold | $119,000-4%$98/sqft |
Source: Public Record Report a problem | ||
| 9/11/2012 | Sold | $123,900+3.3%$102/sqft |
Source: | ||
| 4/1/2012 | Price change | $119,900-7.7%$99/sqft |
Source: Real Living #07985085 Report a problem | ||
| 1/31/2012 | Listed for sale | $129,900-0.1%$107/sqft |
Source: Real Living Gobber Realty #07985085 Report a problem | ||
| 7/16/1996 | Sold | $130,000$107/sqft |
Source: Public Record Report a problem | ||
| Year | Property taxes | Tax assessment |
|---|---|---|
| 2023 | $6,823 +30.8% | $25,999 +52.1% |
| 2022 | $5,216 +3.3% | $17,095 |
| 2021 | $5,048 +2.4% | $17,095 |
| 2020 | $4,932 -5.2% | $17,095 -7.2% |
| 2019 | $5,206 +1.3% | $18,427 |
| 2018 | $5,138 +2% | $18,427 |
| 2017 | $5,039 +10.1% | $18,427 +17.4% |
| 2016 | $4,577 +1.3% | $15,693 |
| 2015 | $4,518 +2.4% | $15,693 |
| 2014 | $4,414 -1.3% | $15,693 -11.7% |
| 2013 | $4,470 +20% | $17,780 |
| 2012 | $3,724 +2.2% | $17,780 |
| 2011 | $3,643 -2.3% | $17,780 -25.6% |
| 2010 | $3,728 +9.9% | $23,897 |
| 2009 | $3,392 +12.9% | $23,897 -5% |
| 2008 | $3,003 +0.1% | $25,154 +20.9% |
| 2007 | $3,000 +3.7% | $20,804 -7.2% |
| 2006 | $2,893 +3.2% | $22,428 |
| 2005 | $2,805 +0.5% | $22,428 +38.5% |
| 2004 | $2,792 +1.6% | $16,188 |
| 2003 | $2,749 +2.6% | $16,188 |
| 2002 | $2,679 +24.8% | $16,188 +20.6% |
| 2001 | $2,146 +1.7% | $13,423 |
| 2000 | $2,111 +3.6% | $13,423 |
| 1999 | $2,037 | $13,423 |
Source: MRED as distributed by MLS GRID. This data may not be complete. We recommend contacting the local school district to confirm school assignments for this home.