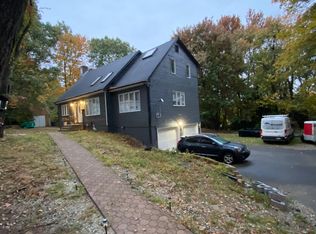
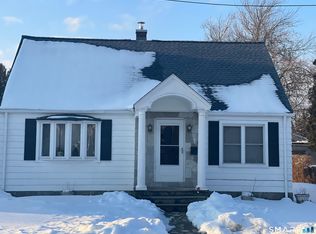
Spacious Cape Cod in a convenient East End location. This home features 3 bedrooms, 1.5 baths, and 1,470 sq ft of living space with a bright open main level. Hardwood floors, updated stairs, and a newer roof add great value. Full basement and 1-car garage. Large open backyard with room to relax or entertain. Connected to public water, sewer, and natural gas. A solid home with great potential - ideal for homeowners or investors looking to build equity.
For sale
Price cut: $10K (3/2)
$320,000
Waterbury, CT 06705
3beds
1,470sqft
Est.:
Single Family Residence
Built in 1936
5,662.8 Square Feet Lot
$-- Zestimate®
$218/sqft
$-- HOA
What's special
- 65 days |
- 642 |
- 13 |
Zillow last checked: 7 hours ago
Listing updated: March 02, 2026 at 02:38pm
Listed by:
Nathaniel Correa (203)247-8512,
Smart Realty Services Corp 203-437-7919
Source: Smart MLS,MLS#: 24149301
Tour with a local agent
Facts & features
Interior
Bedrooms & bathrooms
- Bedrooms: 3
- Bathrooms: 2
- Full bathrooms: 1
- 1/2 bathrooms: 1
Primary bedroom
- Level: Main
Bedroom
- Level: Upper
Bedroom
- Level: Upper
Bathroom
- Level: Upper
Bathroom
- Level: Main
Living room
- Level: Main
Heating
- Hot Water, Natural Gas
Cooling
- None
Appliances
- Included: Oven/Range, Refrigerator, Washer, Dryer, Water Heater
Features
- Basement: Partial,Garage Access
- Attic: None
- Has fireplace: No
Interior area
- Total structure area: 1,470
- Total interior livable area: 1,470 sqft
- Finished area above ground: 1,470
Property
Lot
- Size: 5,662.8 Square Feet
- Features: Level
Details
- Parcel number: 1378872
- Zoning: RL
Construction
Type & style
- Home type: SingleFamily
- Architectural style: Cape Cod
- Property subtype: Single Family Residence
Materials
- Vinyl Siding
- Foundation: Concrete Perimeter
- Roof: Asphalt
Condition
- New construction: No
- Year built: 1936
Utilities & green energy
- Sewer: Public Sewer
- Water: Public
Community & HOA
HOA
- Has HOA: No
Location
- Region: Waterbury
Financial & listing details
- Price per square foot: $218/sqft
- Tax assessed value: $121,170
- Annual tax amount: $4,885
- Date on market: 1/16/2026
Estimated market value
Not available
Estimated sales range
Not available
Not available
Price history
Price history
| Date | Event | Price |
|---|---|---|
| 3/2/2026 | Price change | $320,000-3%$218/sqft |
Source: | ||
| 1/16/2026 | Listed for sale | $330,000+57.1%$224/sqft |
Source: | ||
| 5/22/2023 | Sold | $210,000-4.5%$143/sqft |
Source: | ||
| 5/22/2023 | Contingent | $219,900$150/sqft |
Source: | ||
| 12/30/2022 | Listed for sale | $219,900+164.9%$150/sqft |
Source: | ||
| 6/4/2020 | Sold | $83,000+38.3%$56/sqft |
Source: | ||
| 4/15/2020 | Listed for sale | $60,000-47%$41/sqft |
Source: Equinox Properties #170288358 Report a problem | ||
| 11/28/2019 | Listing removed | -- |
Source: Hudson & Marshall Report a problem | ||
| 11/5/2019 | Listed for sale | -- |
Source: Hudson & Marshall Report a problem | ||
| 3/1/2010 | Sold | $113,300+92%$77/sqft |
Source: | ||
| 9/23/2009 | Sold | $59,000-10.1%$40/sqft |
Source: Public Record Report a problem | ||
| 6/23/2009 | Listing removed | $65,610$45/sqft |
Source: foreclosure.com Report a problem | ||
| 5/3/2009 | Price change | $65,610-10%$45/sqft |
Source: foreclosure.com Report a problem | ||
| 4/1/2009 | Price change | $72,900-10%$50/sqft |
Source: foreclosure.com Report a problem | ||
| 3/2/2009 | Price change | $81,000-10%$55/sqft |
Source: foreclosure.com Report a problem | ||
| 2/2/2009 | Price change | $90,000-10%$61/sqft |
Source: foreclosure.com Report a problem | ||
| 1/11/2009 | Listed for sale | $100,000-16.7%$68/sqft |
Source: foreclosure.com Report a problem | ||
| 4/16/2008 | Sold | $120,000+66.7%$82/sqft |
Source: Public Record Report a problem | ||
| 5/31/2000 | Sold | $72,000$49/sqft |
Source: Public Record Report a problem | ||
Public tax history
Public tax history
| Year | Property taxes | Tax assessment |
|---|---|---|
| 2025 | $5,450 -9% | $121,170 |
| 2024 | $5,991 -8.8% | $121,170 |
| 2023 | $6,566 +53.6% | $121,170 +70.7% |
| 2022 | $4,274 | $70,980 |
| 2021 | $4,274 +0% | $70,980 +2.5% |
| 2020 | $4,274 +2.5% | $69,270 |
| 2019 | $4,171 | $69,270 |
| 2018 | $4,171 -12.1% | $69,270 -12.1% |
| 2017 | $4,744 | $78,790 |
| 2016 | $4,744 +3.4% | $78,790 |
| 2015 | $4,587 | $78,790 |
| 2014 | $4,587 +2.2% | $78,790 |
| 2013 | $4,489 +2% | $78,790 -25.1% |
| 2012 | $4,399 0% | $105,220 |
| 2011 | $4,400 -0.3% | $105,220 -0.3% |
| 2010 | $4,412 +6.3% | $105,490 +1.4% |
| 2009 | $4,152 -0.2% | $104,010 -0.2% |
| 2008 | $4,162 +9.2% | $104,270 +47.6% |
| 2005 | $3,812 +6.1% | $70,630 +7.8% |
| 2002 | $3,594 +132.3% | $65,520 +314.2% |
| 2001 | $1,547 | $15,820 |
BuyAbility℠ payment
Est. payment
$2,186/mo
Principal & interest
$1618
Property taxes
$568
More affordability tools
Climate risks
Neighborhood: Mill Plain
Getting around
33 / 100
Some TransitNearby schools
GreatSchools rating
- 5/10H. S. Chase SchoolGrades: PK-5Distance: 0.7 mi
- 4/10Michael F. Wallace Middle SchoolGrades: 4-8Distance: 2.2 mi
- 1/10Crosby High SchoolGrades: 9-12Distance: 2 mi
Local experts in 06705

Nearby cities
Nearby neighborhoods
Nearby zip codes
Other Waterbury Topics
