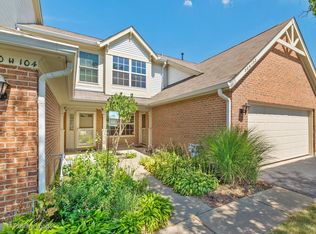
$332,500
2 bd|3 ba|1.5k sqft
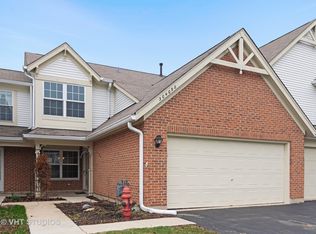
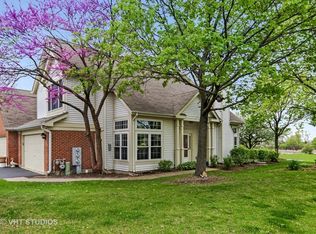
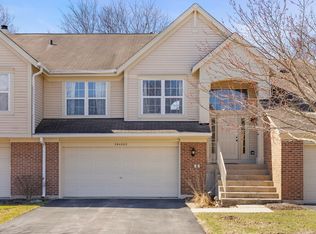
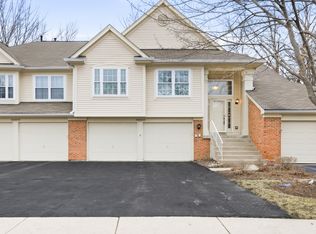
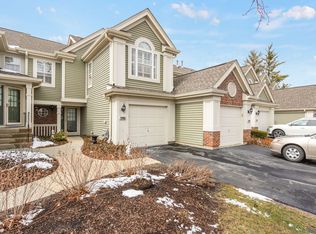
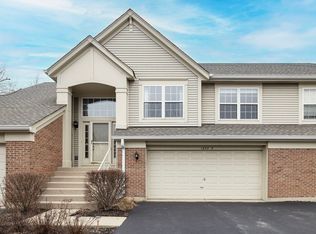
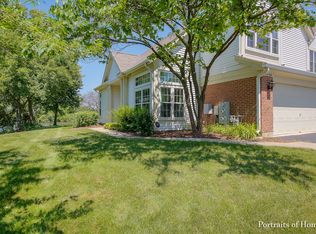
30W106 Fairfax Ct, Warrenville, IL 60555
Off Market
Zillow last checked: 7 hours ago
Listing updated: February 28, 2026 at 07:25pm
Yvonne Rusin, CNC 630-886-5841,
Coldwell Banker Realty
Not available
Estimated sales range
Not available
Not available
| Date | Event | Price |
|---|---|---|
| 3/1/2026 | Contingent | $350,000$201/sqft |
Source: | ||
| 2/26/2026 | Listed for sale | $350,000+40.1%$201/sqft |
Source: | ||
| 2/18/2021 | Sold | $249,900+2%$143/sqft |
Source: | ||
| 1/14/2021 | Pending sale | $244,900$141/sqft |
Source: Fathom Realty IL LLC #10942297 Report a problem | ||
| 1/7/2021 | Listed for sale | $244,900+25.7%$141/sqft |
Source: Fathom Realty IL LLC #10942297 Report a problem | ||
| 9/6/2016 | Sold | $194,900+2.6%$112/sqft |
Source: | ||
| 8/11/2016 | Pending sale | $189,900$109/sqft |
Source: RE/MAX Professionals Select #09267023 Report a problem | ||
| 8/11/2016 | Price change | $189,900$109/sqft |
Source: RE/MAX Professionals Select #09267023 Report a problem | ||
| 7/27/2016 | Price change | -- |
Source: Auction.com Report a problem | ||
| 7/5/2016 | Pending sale | $189,900$109/sqft |
Source: RE/MAX Professionals Select #09267023 Report a problem | ||
| 6/23/2016 | Price change | $189,900+2.7%$109/sqft |
Source: RE/MAX Professionals Select #09267023 Report a problem | ||
| 5/12/2016 | Pending sale | $184,900$106/sqft |
Source: RE/MAX Professionals Select #09267023 Report a problem | ||
| 4/23/2016 | Listed for sale | $184,900-32.8%$106/sqft |
Source: RE/MAX Professionals Select #09267023 Report a problem | ||
| 10/27/2006 | Sold | $275,000+41%$158/sqft |
Source: Public Record Report a problem | ||
| 12/30/2003 | Sold | $195,000$112/sqft |
Source: Public Record Report a problem | ||
| Year | Property taxes | Tax assessment |
|---|---|---|
| 2024 | $7,880 +5.9% | $93,909 +9.5% |
| 2023 | $7,438 +3.5% | $85,770 +7% |
| 2022 | $7,186 +3.6% | $80,160 +4.3% |
| 2021 | $6,938 +2.2% | $76,840 +3.1% |
| 2020 | $6,791 +3.1% | $74,510 +5% |
| 2019 | $6,584 +4.4% | $70,960 +6% |
| 2018 | $6,306 +2.7% | $66,940 +5.2% |
| 2017 | $6,143 +2.9% | $63,610 +7.3% |
| 2016 | $5,972 +2.6% | $59,310 +8% |
| 2015 | $5,822 +2.6% | $54,900 +3% |
| 2014 | $5,676 -1.5% | $53,300 -3.5% |
| 2013 | $5,765 -2.2% | $55,250 -12.1% |
| 2012 | $5,897 +1.8% | $62,880 -9.5% |
| 2011 | $5,793 +0.6% | $69,490 -7.2% |
| 2010 | $5,761 +3.3% | $74,910 -4.4% |
| 2009 | $5,576 +0.2% | $78,340 |
| 2008 | $5,564 +6.2% | $78,340 +7.2% |
| 2007 | $5,239 +10.1% | $73,080 +10% |
| 2006 | $4,761 -3.3% | $66,430 -0.5% |
| 2005 | $4,924 +5.5% | $66,760 +6.1% |
| 2004 | $4,669 +26.4% | $62,920 +7% |
| 2003 | $3,693 -0.9% | $58,800 +9% |
| 2002 | $3,727 +1.4% | $53,940 +7.5% |
| 2001 | $3,676 +3.5% | $50,180 +5.3% |
| 2000 | $3,554 | $47,650 |
Source: MRED as distributed by MLS GRID. This data may not be complete. We recommend contacting the local school district to confirm school assignments for this home.