$163,800
3 bd|1 ba|1.8k sqft
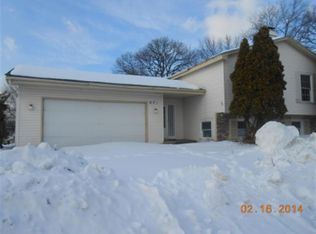
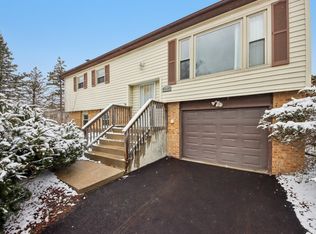
665 Sullivan Ln, University Park, IL 60484
Off Market
Zillow last checked: 7 hours ago
Listing updated: March 31, 2026 at 01:31pm
Thomas Domasik 708-923-0900,
RE/MAX 10 in the Park
$168,400
$160,000 - $177,000
$2,071/mo
| Date | Event | Price |
|---|---|---|
| 3/31/2026 | Listed for sale | $169,873$89/sqft |
Source: | ||
| 3/20/2026 | Contingent | $169,873$89/sqft |
Source: | ||
| 3/7/2026 | Listed for sale | $169,873$89/sqft |
Source: | ||
| 2/18/2026 | Contingent | $169,873$89/sqft |
Source: | ||
| 2/5/2026 | Listed for sale | $169,873$89/sqft |
Source: | ||
| 2/2/2026 | Contingent | $169,873$89/sqft |
Source: | ||
| 1/14/2026 | Listed for sale | $169,873-15%$89/sqft |
Source: | ||
| 8/6/2025 | Listing removed | $199,873$105/sqft |
Source: | ||
| 7/11/2025 | Listed for sale | $199,873-2.5%$105/sqft |
Source: | ||
| 7/2/2025 | Listing removed | $205,000$108/sqft |
Source: | ||
| 6/5/2025 | Price change | $205,000-6.4%$108/sqft |
Source: | ||
| 6/2/2025 | Price change | $219,000+4.3%$115/sqft |
Source: | ||
| 5/28/2025 | Price change | $210,000-3.7%$111/sqft |
Source: | ||
| 5/18/2025 | Price change | $218,000-0.5%$115/sqft |
Source: | ||
| 5/1/2025 | Listed for sale | $219,000$115/sqft |
Source: | ||
| 3/4/2025 | Listing removed | $219,000$115/sqft |
Source: | ||
| 2/26/2025 | Contingent | $219,000$115/sqft |
Source: | ||
| 2/19/2025 | Listed for sale | $219,000$115/sqft |
Source: | ||
| 2/18/2025 | Contingent | $219,000$115/sqft |
Source: | ||
| 2/8/2025 | Listed for sale | $219,000+4.5%$115/sqft |
Source: | ||
| 4/24/2024 | Listing removed | -- |
Source: | ||
| 4/13/2024 | Listing removed | -- |
Source: MRED as distributed by MLS GRID #12025231 Report a problem | ||
| 4/9/2024 | Listed for rent | $1,800$1/sqft |
Source: MRED as distributed by MLS GRID #12025231 Report a problem | ||
| 4/3/2024 | Price change | $209,500-0.2%$110/sqft |
Source: | ||
| 3/23/2024 | Listed for sale | $210,000+8.2%$111/sqft |
Source: | ||
| 5/4/2022 | Sold | $194,000+198.5%$102/sqft |
Source: | ||
| 3/31/2011 | Sold | $65,000-65.1%$34/sqft |
Source: | ||
| 8/17/2010 | Sold | $186,259$98/sqft |
Source: Public Record Report a problem | ||
| 12/21/2009 | Sold | $186,259+100.3%$98/sqft |
Source: Public Record Report a problem | ||
| 1/27/1999 | Sold | $93,000$49/sqft |
Source: Public Record Report a problem | ||
| Year | Property taxes | Tax assessment |
|---|---|---|
| 2023 | -- | $54,474 +13.7% |
| 2022 | $1,969 -64.5% | $47,918 +9.8% |
| 2021 | $5,550 +1.4% | $43,632 +3.4% |
| 2020 | $5,474 -0.8% | $42,217 +5.5% |
| 2019 | $5,519 +2.7% | $40,035 +4.1% |
| 2018 | $5,373 +3.3% | $38,469 +4.7% |
| 2017 | $5,201 +6.5% | $36,745 +5.5% |
| 2016 | $4,883 +15.3% | $34,817 +9.4% |
| 2015 | $4,236 | $31,811 +1.4% |
| 2014 | $4,236 +2.2% | $31,372 -4.5% |
| 2013 | $4,146 -19.2% | $32,850 -11.1% |
| 2012 | $5,130 -4.3% | $36,954 -14.2% |
| 2011 | $5,359 -1.1% | $43,083 -9.2% |
| 2010 | $5,421 -1.9% | $47,469 -6.3% |
| 2009 | $5,528 +2.1% | $50,650 |
| 2008 | $5,416 | $50,650 +8.6% |
| 2007 | -- | $46,650 +31.7% |
| 2006 | $3,658 -16.5% | $35,423 -12.2% |
| 2005 | $4,381 +17.2% | $40,342 +12.6% |
| 2004 | $3,737 +2.1% | $35,825 +8.1% |
| 2003 | $3,658 +1.1% | $33,154 +1.8% |
| 2002 | $3,619 +7.6% | $32,582 +2.2% |
| 2001 | $3,363 +6.3% | $31,893 +3% |
| 2000 | $3,163 | $30,964 |
Source: MRED as distributed by MLS GRID. This data may not be complete. We recommend contacting the local school district to confirm school assignments for this home.