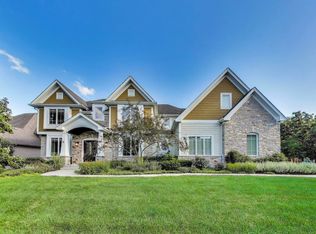
$815,000
4 bd|4 ba|4k sqft
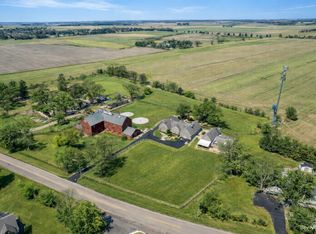
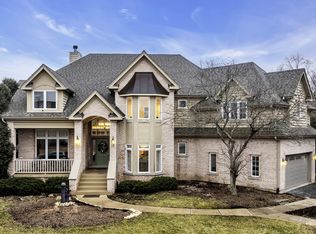
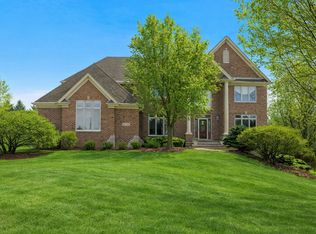
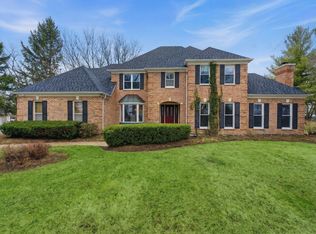
643 Oak Ln, South Elgin, IL 60177
Sold
Zillow last checked: 7 hours ago
Listing updated: March 03, 2026 at 07:47am
Paul Chadwick 630-802-9406,
Baird & Warner Fox Valley - Geneva,
Lisa Schutz, CSC 630-205-2162,
Baird & Warner Fox Valley - Geneva
Not available
Estimated sales range
Not available
Not available
| Date | Event | Price |
|---|---|---|
| 3/3/2026 | Contingent | $850,000$181/sqft |
Source: | ||
| 1/28/2026 | Listed for sale | $850,000+6.3%$181/sqft |
Source: | ||
| 8/4/2025 | Listing removed | $800,000$171/sqft |
Source: | ||
| 7/30/2025 | Price change | $800,000+0.1%$171/sqft |
Source: | ||
| 7/15/2025 | Price change | $799,000-0.1%$170/sqft |
Source: | ||
| 6/26/2025 | Price change | $800,000-5.9%$171/sqft |
Source: | ||
| 6/10/2025 | Listed for sale | $850,000+49.8%$181/sqft |
Source: | ||
| 6/1/2016 | Sold | $567,500-1.3%$121/sqft |
Source: | ||
| 4/3/2016 | Pending sale | $575,000$123/sqft |
Source: RE/MAX of Barrington #09174275 Report a problem | ||
| 3/25/2016 | Price change | $575,000-0.9%$123/sqft |
Source: RE/MAX of Barrington #09174275 Report a problem | ||
| 2/23/2016 | Price change | $579,999-3.3%$124/sqft |
Source: RE/MAX of Barrington #09123101 Report a problem | ||
| 1/25/2016 | Price change | $599,9000%$128/sqft |
Source: RE/MAX of Barrington #09123101 Report a problem | ||
| 7/25/2015 | Price change | $600,000-2.4%$128/sqft |
Source: RE/MAX of Barrington #08992145 Report a problem | ||
| 7/8/2015 | Price change | $615,000-1.6%$131/sqft |
Source: Berkshire Hathaway HomeServices Starck Real Estate #08934999 Report a problem | ||
| 7/1/2015 | Price change | $625,000-1.6%$133/sqft |
Source: Berkshire Hathaway HomeServices Starck Real Estate #08934999 Report a problem | ||
| 5/28/2015 | Listed for sale | $635,000+10.4%$135/sqft |
Source: Berkshire Hathaway HomeServices Starck Real Estate #08934999 Report a problem | ||
| 7/25/2003 | Sold | $575,000$123/sqft |
Source: Public Record Report a problem | ||
| Year | Property taxes | Tax assessment |
|---|---|---|
| 2024 | $17,507 +4.5% | $225,554 +11.7% |
| 2023 | $16,755 +7% | $201,874 +9% |
| 2022 | $15,662 +4.1% | $185,287 +4.9% |
| 2021 | $15,051 +0.4% | $176,616 +1.9% |
| 2020 | $14,987 +1.6% | $173,323 +2% |
| 2019 | $14,756 -2.8% | $169,892 -2.3% |
| 2018 | $15,182 -3% | $173,928 -3.8% |
| 2017 | $15,649 -7.6% | $180,874 +3.6% |
| 2016 | $16,937 | $174,522 +1.1% |
| 2015 | -- | $172,706 +1.5% |
| 2014 | -- | $170,136 -3.6% |
| 2013 | -- | $176,535 -3% |
| 2012 | -- | $181,965 -6.4% |
| 2011 | -- | $194,439 -4.5% |
| 2010 | -- | $203,653 +5.5% |
| 2009 | -- | $192,950 -12.9% |
| 2008 | -- | $221,570 |
| 2007 | -- | $221,570 +6.9% |
| 2006 | -- | $207,181 +10.2% |
| 2005 | -- | $187,930 +3.2% |
| 2004 | -- | $182,086 +39.3% |
| 2003 | -- | $130,687 +330.3% |
| 2002 | -- | $30,372 +659.3% |
| 2001 | -- | $4,000 |
Source: MRED as distributed by MLS GRID. This data may not be complete. We recommend contacting the local school district to confirm school assignments for this home.