$286,900
3 bd|2 ba|1.6k sqft
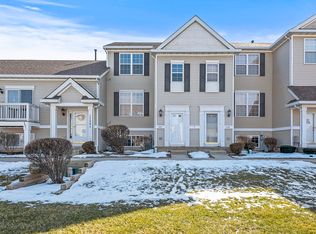
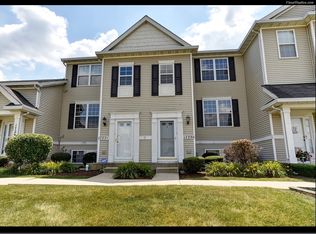
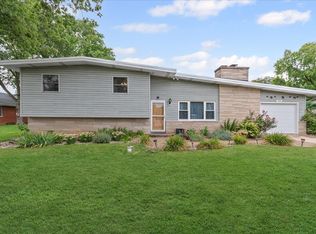
1729 Fieldstone Dr S, Shorewood, IL 60404
Off Market
Zillow last checked: 7 hours ago
Listing updated: March 29, 2026 at 05:38am
Michelle Carr (815)739-1339,
eXp Realty
Not available
Estimated sales range
Not available
Not available
| Date | Event | Price |
|---|---|---|
| 3/13/2026 | Price change | $253,000-0.8%$186/sqft |
Source: | ||
| 2/24/2026 | Listed for sale | $255,000+11.4%$187/sqft |
Source: | ||
| 6/27/2024 | Sold | $229,000+4.1%$168/sqft |
Source: | ||
| 5/28/2024 | Contingent | $220,000$162/sqft |
Source: | ||
| 5/22/2024 | Listed for sale | $220,000+12.9%$162/sqft |
Source: | ||
| 7/7/2022 | Listing removed | -- |
Source: Zillow Rental Manager Report a problem | ||
| 6/7/2022 | Listed for rent | $2,075$2/sqft |
Source: Zillow Rental Manager Report a problem | ||
| 10/1/2021 | Sold | $194,900$143/sqft |
Source: | ||
| 8/21/2021 | Contingent | $194,900$143/sqft |
Source: | ||
| 8/17/2021 | Listed for sale | $194,900+40.2%$143/sqft |
Source: | ||
| 4/14/2017 | Sold | $139,000-0.6%$102/sqft |
Source: Public Record Report a problem | ||
| 3/2/2017 | Pending sale | $139,900$103/sqft |
Source: john greene Realtor #09516512 Report a problem | ||
| 3/1/2017 | Listed for sale | $139,900-15.2%$103/sqft |
Source: john greene Realtor #09516512 Report a problem | ||
| 6/1/2005 | Sold | $165,000+12.2%$121/sqft |
Source: Public Record Report a problem | ||
| 5/8/2003 | Sold | $147,000$108/sqft |
Source: Public Record Report a problem | ||
| Year | Property taxes | Tax assessment |
|---|---|---|
| 2023 | $4,553 +6.4% | $66,455 +9.4% |
| 2022 | $4,277 +6.6% | $60,770 +6.3% |
| 2021 | $4,012 +6.6% | $57,168 +7.4% |
| 2020 | $3,762 +2.3% | $53,236 +4.2% |
| 2019 | $3,677 +7.1% | $51,066 +7.4% |
| 2018 | $3,435 +1.6% | $47,550 +2.6% |
| 2017 | $3,382 +4.6% | $46,351 +5.5% |
| 2016 | $3,232 +17.4% | $43,942 +5.8% |
| 2015 | $2,753 | $41,545 +6.4% |
| 2014 | $2,753 +2.8% | $39,045 |
| 2013 | $2,677 -8% | $39,045 -9.7% |
| 2012 | $2,910 -14.2% | $43,240 -15.6% |
| 2011 | $3,392 +0.3% | $51,225 -2.1% |
| 2010 | $3,382 -1.4% | $52,339 -2.2% |
| 2009 | $3,429 +0.3% | $53,543 |
| 2008 | $3,419 | $53,543 +2.2% |
| 2007 | -- | $52,396 +2.9% |
| 2006 | $3,320 +16.1% | $50,933 +13.9% |
| 2005 | $2,860 +0.6% | $44,728 +1.4% |
| 2004 | $2,843 +80.8% | $44,089 +74.4% |
| 2003 | $1,573 | $25,277 |
Source: MRED as distributed by MLS GRID. This data may not be complete. We recommend contacting the local school district to confirm school assignments for this home.