$146,400
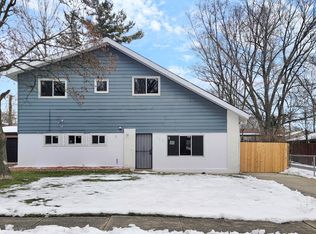
4 bd|2 ba|2k sqft
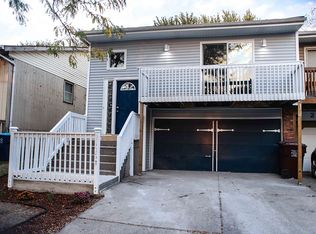
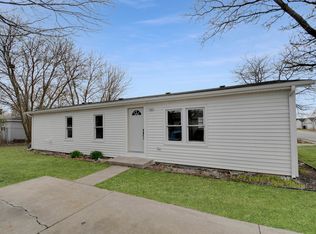
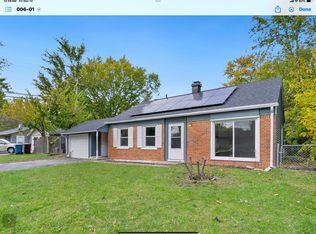
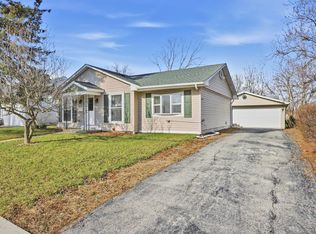
21777 Peterson Ave, Sauk Village, IL 60411
Off Market
Zillow last checked: 7 hours ago
Listing updated: March 20, 2026 at 10:06pm
Gary Alveranga (312)324-0525,
Real People Realty
Not available
Estimated sales range
Not available
Not available
| Date | Event | Price |
|---|---|---|
| 3/15/2026 | Price change | $164,900-0.1%$118/sqft |
Source: | ||
| 2/12/2026 | Listed for sale | $165,000+266.7%$118/sqft |
Source: | ||
| 3/24/2021 | Listing removed | -- |
Source: Owner Report a problem | ||
| 1/3/2019 | Sold | $45,000-2%$32/sqft |
Source: Public Record Report a problem | ||
| 9/27/2018 | Price change | $45,900+27.5%$33/sqft |
Source: Owner Report a problem | ||
| 8/17/2018 | Listed for sale | $36,000-14.3%$26/sqft |
Source: Owner Report a problem | ||
| 3/12/2018 | Listing removed | $42,000$30/sqft |
Source: Tanis Group Realty #09855055 Report a problem | ||
| 2/12/2018 | Listed for sale | $42,000-86%$30/sqft |
Source: Tanis Group Realty #09855055 Report a problem | ||
| 1/22/2018 | Listing removed | $850$1/sqft |
Source: Owner Report a problem | ||
| 1/9/2018 | Listed for rent | $850-10.5%$1/sqft |
Source: Owner Report a problem | ||
| 3/13/2017 | Sold | $300,000$214/sqft |
Source: Public Record Report a problem | ||
| 8/17/2016 | Listing removed | $950+46.2%$1/sqft |
Source: Go Section8 Report a problem | ||
| 2/10/2016 | Listing removed | $650 |
Source: Owner Report a problem | ||
| 2/2/2016 | Listed for rent | $650 |
Source: Owner Report a problem | ||
| 12/24/2015 | Listing removed | $650 |
Source: Owner Report a problem | ||
| 11/23/2015 | Listed for rent | $650 |
Source: Owner Report a problem | ||
| Year | Property taxes | Tax assessment |
|---|---|---|
| 2023 | $2,481 -7% | $6,396 +23.4% |
| 2022 | $2,669 -1% | $5,182 |
| 2021 | $2,694 +6% | $5,182 |
| 2020 | $2,543 -21.9% | $5,182 -29.3% |
| 2019 | $3,254 +85.2% | $7,325 |
| 2018 | $1,757 -7.5% | $7,325 |
| 2017 | $1,898 +10.8% | $7,325 +24.7% |
| 2016 | $1,713 -7.9% | $5,876 -9.2% |
| 2015 | $1,859 +86.1% | $6,470 |
| 2014 | $999 -43.8% | $6,470 -2.8% |
| 2013 | $1,779 -1.2% | $6,659 |
| 2012 | $1,801 -3.4% | $6,659 |
| 2011 | $1,865 +11.2% | $6,659 -12.5% |
| 2010 | $1,677 +10.9% | $7,610 |
| 2009 | $1,512 +6.3% | $7,610 -5% |
| 2008 | $1,422 +0.3% | $8,012 +14.4% |
| 2007 | $1,419 +5.1% | $7,005 |
| 2006 | $1,350 +9.2% | $7,005 |
| 2005 | $1,237 -3.1% | $7,005 +13.4% |
| 2004 | $1,276 0% | $6,177 |
| 2003 | $1,277 -2.8% | $6,177 |
| 2002 | $1,313 +6.1% | $6,177 +3% |
| 2001 | $1,238 +1.6% | $5,998 |
| 2000 | $1,218 +17% | $5,998 |
| 1999 | $1,041 | $5,998 |
Source: MRED as distributed by MLS GRID. This data may not be complete. We recommend contacting the local school district to confirm school assignments for this home.