$427,500
3 bd|3 ba|2.6k sqft
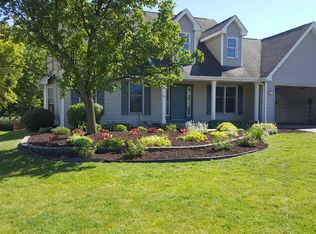
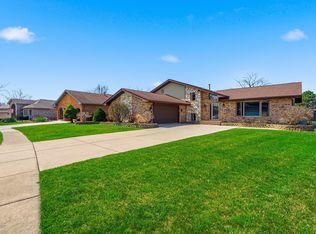
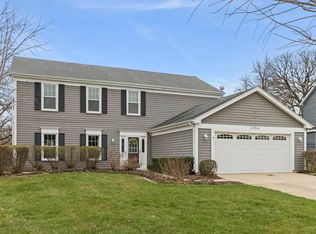
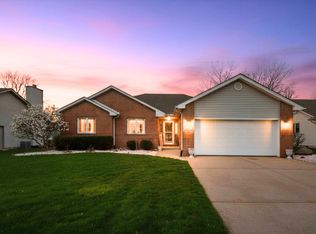
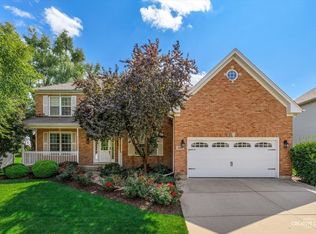
815 Erie Dr, Romeoville, IL 60446
Off Market
Zillow last checked: 7 hours ago
Listing updated: April 10, 2026 at 03:43am
Sherry Pope, ABR,CRS,CSC,GRI,SRES 847-301-3100,
Coldwell Banker Realty
Not available
Estimated sales range
Not available
Not available
| Date | Event | Price |
|---|---|---|
| 4/10/2026 | Listed for sale | $499,900+33.3%$167/sqft |
Source: | ||
| 4/8/2021 | Sold | $375,000+8.7%$125/sqft |
Source: | ||
| 6/22/2019 | Listing removed | $345,000$115/sqft |
Source: Villarreal Real Estate Inc. #10389517 Report a problem | ||
| 6/6/2019 | Price change | $345,000-2.8%$115/sqft |
Source: Villarreal Real Estate Inc. #10389517 Report a problem | ||
| 5/29/2019 | Price change | $355,000-2.7%$118/sqft |
Source: Villarreal Real Estate Inc. #10389517 Report a problem | ||
| 5/23/2019 | Listed for sale | $365,000+22.2%$122/sqft |
Source: Villarreal Real Estate Inc. #10389517 Report a problem | ||
| 10/16/2009 | Listing removed | $298,700$100/sqft |
Source: Monroe Realty & Financial Enterprises, Inc. #07255786 Report a problem | ||
| 10/8/2009 | Price change | $298,700-2%$100/sqft |
Source: Monroe Realty & Financial Enterprises, Inc. #07255786 Report a problem | ||
| 9/5/2009 | Price change | $304,700-4.7%$102/sqft |
Source: Monroe Realty & Financial Enterprises, Inc. #07255786 Report a problem | ||
| 7/20/2009 | Price change | $319,700-5.9%$107/sqft |
Source: Monroe Realty & Financial Enterprises, Inc. #07255786 Report a problem | ||
| 7/1/2009 | Listed for sale | $339,700+51.7%$113/sqft |
Source: Monroe Realty & Financial Enterprises, Inc. #07255786 Report a problem | ||
| 4/21/1998 | Sold | $224,000+21.4%$75/sqft |
Source: Public Record Report a problem | ||
| 1/19/1994 | Sold | $184,500$62/sqft |
Source: Public Record Report a problem | ||
| Year | Property taxes | Tax assessment |
|---|---|---|
| 2023 | $10,310 +7.5% | $119,685 +10.9% |
| 2022 | $9,589 +7.9% | $107,902 +9.5% |
| 2021 | $8,889 +2.8% | $98,563 +3.4% |
| 2020 | $8,645 +3.9% | $95,322 +5% |
| 2019 | $8,317 +3.3% | $90,783 +4.5% |
| 2018 | $8,047 +5.8% | $86,890 +5.5% |
| 2017 | $7,604 +4% | $82,360 +5.1% |
| 2016 | $7,310 +8% | $78,400 +4.3% |
| 2015 | $6,768 | $75,200 +7% |
| 2014 | $6,768 +15.2% | $70,300 +10% |
| 2013 | $5,874 +4.5% | $63,900 -3% |
| 2012 | $5,619 +12.5% | $65,900 |
| 2011 | $4,994 -14.8% | $65,900 -22% |
| 2010 | $5,863 -5.2% | $84,500 -9.9% |
| 2009 | $6,182 +5.8% | $93,800 |
| 2008 | $5,843 | $93,800 -6.3% |
| 2007 | -- | $100,100 +20% |
| 2006 | $5,516 -4.3% | $83,400 |
| 2005 | $5,762 +0.7% | $83,400 +0.2% |
| 2004 | $5,724 +21% | $83,200 +20.4% |
| 2003 | $4,732 -4.7% | $69,100 +0.3% |
| 2002 | $4,963 +12.3% | $68,900 +16.8% |
| 2001 | $4,421 +4.9% | $59,000 |
| 2000 | $4,215 | $59,000 |
Source: MRED as distributed by MLS GRID. This data may not be complete. We recommend contacting the local school district to confirm school assignments for this home.