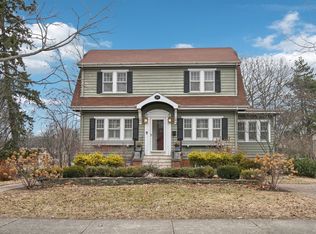
$757,800
5 bd|3 ba|2.7k sqft
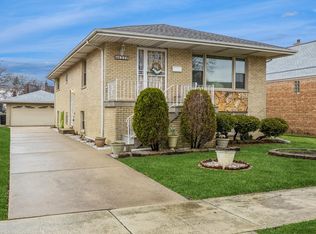
279 Bartram Rd, Riverside, IL 60546
Off Market
Zillow last checked: 7 hours ago
Listing updated: 17 hours ago
Jon Keller 312-388-3443,
@properties Christie's International Real Estate,
Edward Bellock 630-253-7000,
@properties Christie's International Real Estate
Not available
Estimated sales range
Not available
Not available
| Date | Event | Price |
|---|---|---|
| 4/8/2026 | Listed for sale | $695,000+25%$178/sqft |
Source: | ||
| 8/13/2020 | Sold | $556,000-2.3%$143/sqft |
Source: | ||
| 7/18/2020 | Pending sale | $569,000$146/sqft |
Source: @properties #10782170 Report a problem | ||
| 7/15/2020 | Listed for sale | $569,000+16.1%$146/sqft |
Source: @properties #10782170 Report a problem | ||
| 9/20/2018 | Sold | $490,000-3.9%$126/sqft |
Source: | ||
| 8/2/2018 | Pending sale | $510,000$131/sqft |
Source: @properties #09880271 Report a problem | ||
| 7/18/2018 | Price change | $510,000-4.7%$131/sqft |
Source: @properties #09880271 Report a problem | ||
| 5/31/2018 | Price change | $535,000-2.7%$137/sqft |
Source: @properties #09880271 Report a problem | ||
| 4/11/2018 | Price change | $550,000-6.6%$141/sqft |
Source: @properties #09880271 Report a problem | ||
| 3/10/2018 | Listed for sale | $589,000$151/sqft |
Source: @properties #09880271 Report a problem | ||
| Year | Property taxes | Tax assessment |
|---|---|---|
| 2023 | $13,639 +12.3% | $45,950 +30.8% |
| 2022 | $12,149 +3.8% | $35,137 |
| 2021 | $11,706 +2.6% | $35,137 |
| 2020 | $11,404 +0.6% | $35,137 +9.1% |
| 2019 | $11,334 +27.5% | $32,202 |
| 2018 | $8,888 -22% | $32,202 -14.9% |
| 2017 | $11,399 +10.8% | $37,861 +19.3% |
| 2016 | $10,293 +2.8% | $31,724 |
| 2015 | $10,014 +1.6% | $31,724 |
| 2014 | $9,861 -10.7% | $31,724 -16.6% |
| 2013 | $11,046 +1.2% | $38,036 |
| 2012 | $10,916 +3.6% | $38,036 |
| 2011 | $10,539 +1.1% | $38,036 -14.4% |
| 2010 | $10,422 +5.3% | $44,452 |
| 2009 | $9,900 +19.4% | $44,452 -12% |
| 2008 | $8,294 -3.7% | $50,514 +16.2% |
| 2007 | $8,612 +10.1% | $43,462 |
| 2006 | $7,820 +7.5% | $43,462 |
| 2005 | $7,274 +11.5% | $43,462 +33.1% |
| 2004 | $6,522 +3.2% | $32,643 |
| 2003 | $6,322 +11.6% | $32,643 |
| 2002 | $5,666 +11.2% | $32,643 +22.8% |
| 2001 | $5,097 +2.7% | $26,583 |
| 2000 | $4,965 +11.4% | $26,583 |
| 1999 | $4,456 | $26,583 |
Source: MRED as distributed by MLS GRID. This data may not be complete. We recommend contacting the local school district to confirm school assignments for this home.