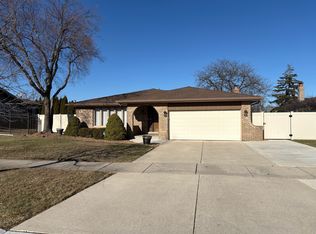
$503,400
4 bd|4 ba|2.8k sqft
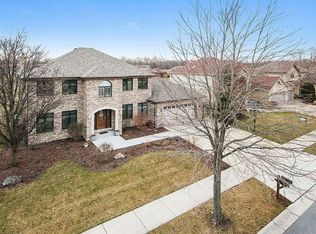
14820 Landings Ln, Oak Forest, IL 60452
Off Market
Zillow last checked: 7 hours ago
Listing updated: April 03, 2026 at 11:04pm
Carmen Mitulescu 708-612-5991,
Strategic Realty & Investments LLC
$516,500
$491,000 - $542,000
$5,682/mo
| Date | Event | Price |
|---|---|---|
| 4/4/2026 | Listed for sale | $525,000+66.7%$150/sqft |
Source: | ||
| 8/18/2017 | Sold | $315,000-7.2%$90/sqft |
Source: | ||
| 7/26/2017 | Pending sale | $339,500$97/sqft |
Source: Strategic Realty & Investments LLC #09698308 Report a problem | ||
| 7/22/2017 | Listed for sale | $339,500$97/sqft |
Source: Strategic Realty & Investments LLC #09698308 Report a problem | ||
| 7/1/2017 | Pending sale | $339,500$97/sqft |
Source: Strategic Realty & Investments LLC #09698308 Report a problem | ||
| 5/31/2017 | Price change | $339,500-0.1%$97/sqft |
Source: Strategic Realty & Investments LLC #09698308 Report a problem | ||
| 4/18/2017 | Price change | $339,900-2.7%$97/sqft |
Source: Strategic Realty & Investments LLC #09698308 Report a problem | ||
| 2/18/2017 | Price change | $349,500-5.5%$100/sqft |
Source: Strategic Realty & Investments LLC #09698308 Report a problem | ||
| 8/15/2016 | Listed for sale | $369,900+572.5%$106/sqft |
Source: RE/MAX 1st Service #09316366 Report a problem | ||
| 7/2/1998 | Sold | $55,000$16/sqft |
Source: Public Record Report a problem | ||
| Year | Property taxes | Tax assessment |
|---|---|---|
| 2023 | $13,042 +23.1% | $45,000 +57.1% |
| 2022 | $10,592 +2.2% | $28,648 |
| 2021 | $10,367 +3.1% | $28,648 |
| 2020 | $10,058 -7% | $28,648 -5.3% |
| 2019 | $10,810 +1.7% | $30,267 |
| 2018 | $10,625 -18.2% | $30,267 -16.1% |
| 2017 | $12,987 +8.1% | $36,062 +13.7% |
| 2016 | $12,011 +2.9% | $31,729 |
| 2015 | $11,673 +2.8% | $31,729 |
| 2014 | $11,355 +16.1% | $31,729 +3.5% |
| 2013 | $9,784 +3.6% | $30,658 |
| 2012 | $9,440 -14.1% | $30,658 -17.7% |
| 2011 | $10,992 +9.4% | $37,243 -8.3% |
| 2010 | $10,051 +4% | $40,606 |
| 2009 | $9,660 +16.3% | $40,606 -5% |
| 2008 | $8,307 -1% | $42,744 +10.6% |
| 2007 | $8,392 +2.4% | $38,632 |
| 2006 | $8,199 +2.2% | $38,632 |
| 2005 | $8,022 +21% | $38,632 +42.2% |
| 2004 | $6,628 +4% | $27,158 |
| 2003 | $6,374 -8.9% | $27,158 -11.9% |
| 2002 | $6,999 +23.5% | $30,821 +23.6% |
| 2001 | $5,666 +2.3% | $24,933 |
| 2000 | $5,540 +154.9% | $24,933 |
| 1999 | $2,174 | $24,933 |
Source: MRED as distributed by MLS GRID. This data may not be complete. We recommend contacting the local school district to confirm school assignments for this home.