$197,600
2 bd|1 ba|927 sqft
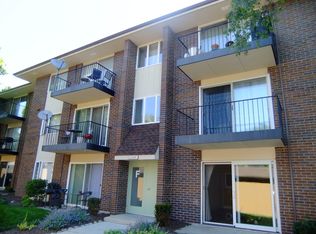
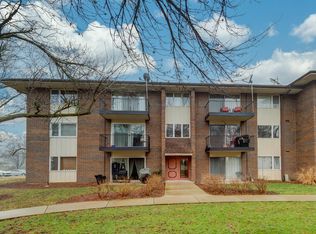
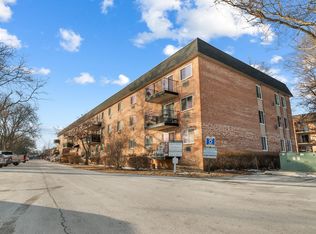
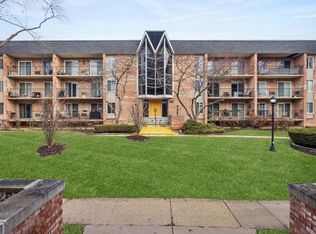
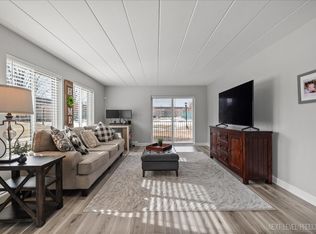
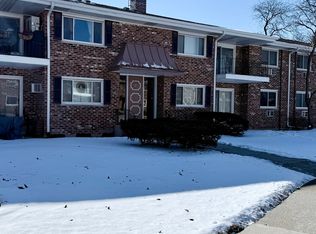
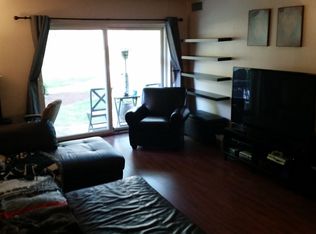
5S070 Pebblewood Ln APT F1, Naperville, IL 60563
Off Market
Zillow last checked: 8 hours ago
Listing updated: February 26, 2026 at 01:14pm
Ruperto Ibay 630-853-1630,
Charles Rutenberg Realty of IL
$161,900
$154,000 - $170,000
$1,756/mo
| Date | Event | Price |
|---|---|---|
| 2/26/2026 | Contingent | $165,000$206/sqft |
Source: | ||
| 2/25/2026 | Listed for sale | $165,000$206/sqft |
Source: | ||
| 2/19/2026 | Contingent | $165,000$206/sqft |
Source: | ||
| 2/11/2026 | Listed for sale | $165,000+43.5%$206/sqft |
Source: | ||
| 5/27/2021 | Sold | $115,000+15.3%$144/sqft |
Source: | ||
| 6/28/2019 | Sold | $99,700+0.2%$125/sqft |
Source: | ||
| 5/26/2019 | Pending sale | $99,500$124/sqft |
Source: Charles Rutenberg Realty of IL #10273517 Report a problem | ||
| 5/11/2019 | Price change | $99,500-0.4%$124/sqft |
Source: Charles Rutenberg Realty of IL #10273517 Report a problem | ||
| 4/23/2019 | Price change | $99,900-1.6%$125/sqft |
Source: Charles Rutenberg Realty of IL #10273517 Report a problem | ||
| 4/3/2019 | Price change | $101,500-0.5%$127/sqft |
Source: Charles Rutenberg Realty of IL #10273517 Report a problem | ||
| 3/22/2019 | Price change | $102,000-1.4%$128/sqft |
Source: Charles Rutenberg Realty of IL #10273517 Report a problem | ||
| 2/15/2019 | Price change | $103,500-1.9%$129/sqft |
Source: Charles Rutenberg Realty of IL #10273517 Report a problem | ||
| 1/11/2019 | Price change | $105,500-0.5%$132/sqft |
Source: Charles Rutenberg Realty of IL #10079906 Report a problem | ||
| 12/27/2018 | Price change | $106,000-1.4%$133/sqft |
Source: Charles Rutenberg Realty of IL #10079906 Report a problem | ||
| 12/13/2018 | Listed for sale | $107,500$134/sqft |
Source: Charles Rutenberg Realty of IL #10079906 Report a problem | ||
| 11/25/2018 | Pending sale | $107,500$134/sqft |
Source: Charles Rutenberg Realty of IL #10079906 Report a problem | ||
| 11/8/2018 | Price change | $107,500-2.2%$134/sqft |
Source: Charles Rutenberg Realty of IL #10079906 Report a problem | ||
| 11/2/2018 | Price change | $109,900-2.3%$137/sqft |
Source: Charles Rutenberg Realty of IL #10079906 Report a problem | ||
| 10/9/2018 | Price change | $112,500-2.1%$141/sqft |
Source: Charles Rutenberg Realty of IL #10079906 Report a problem | ||
| 10/5/2018 | Listed for sale | $114,900+51.2%$144/sqft |
Source: Charles Rutenberg Realty of IL #10079906 Report a problem | ||
| 8/3/2018 | Sold | $76,000-5%$95/sqft |
Source: | ||
| 7/10/2018 | Pending sale | $80,000$100/sqft |
Source: john greene Realtor #10008414 Report a problem | ||
| 7/6/2018 | Listed for sale | $80,000+60%$100/sqft |
Source: john greene Realtor #10008414 Report a problem | ||
| 6/19/2014 | Listing removed | $900$1/sqft |
Source: john greene, Realtor #08600003 Report a problem | ||
| 5/1/2014 | Price change | $900$1/sqft |
Source: john greene, Realtor #08600003 Report a problem | ||
| 3/7/2014 | Sold | $50,000-57.3%$63/sqft |
Source: Agent Provided Report a problem | ||
| 10/29/2007 | Sold | $117,000+12.5%$146/sqft |
Source: Public Record Report a problem | ||
| 5/3/2005 | Sold | $104,000+79.3%$130/sqft |
Source: Public Record Report a problem | ||
| 3/3/2000 | Sold | $58,000+5.5%$73/sqft |
Source: Public Record Report a problem | ||
| 7/10/1997 | Sold | $55,000$69/sqft |
Source: Public Record Report a problem | ||
| Year | Property taxes | Tax assessment |
|---|---|---|
| 2024 | $1,607 +7.2% | $36,369 +11.3% |
| 2023 | $1,498 +5.6% | $32,680 +13.2% |
| 2022 | $1,418 +4.5% | $28,870 +3.7% |
| 2021 | $1,357 +0.1% | $27,840 |
| 2020 | $1,355 -18.5% | $27,840 +5.2% |
| 2019 | $1,663 +16.3% | $26,470 +18.9% |
| 2018 | $1,430 +2.4% | $22,270 +3.5% |
| 2017 | $1,396 +1.7% | $21,520 +4.2% |
| 2016 | $1,373 +0.8% | $20,650 +5.4% |
| 2015 | $1,362 +36.2% | $19,600 -1.9% |
| 2014 | $1,000 -0.3% | $19,980 -0.7% |
| 2013 | $1,003 -20.9% | $20,120 -18.7% |
| 2012 | $1,269 -0.2% | $24,740 -6.4% |
| 2011 | $1,271 -21% | $26,440 -21.4% |
| 2010 | $1,608 +3.4% | $33,620 -4% |
| 2009 | $1,555 +1.1% | $35,020 +1.8% |
| 2008 | $1,538 -11.4% | $34,400 +5.8% |
| 2007 | $1,737 +3.6% | $32,510 +7.8% |
| 2006 | $1,677 +27.2% | $30,150 +8.7% |
| 2005 | $1,318 +14.3% | $27,730 +14.2% |
| 2004 | $1,153 +3% | $24,290 +11.1% |
| 2003 | $1,119 +15.6% | $21,860 +13.1% |
| 2002 | $968 +11.5% | $19,320 +10% |
| 2001 | $869 +6.8% | $17,570 +4.4% |
| 2000 | $813 | $16,830 |
Source: MRED as distributed by MLS GRID. This data may not be complete. We recommend contacting the local school district to confirm school assignments for this home.