$494,300
-- bd|-- ba|-- sqft
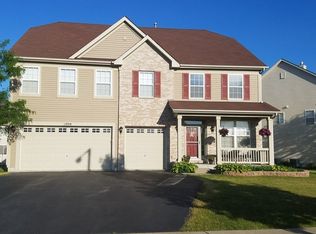
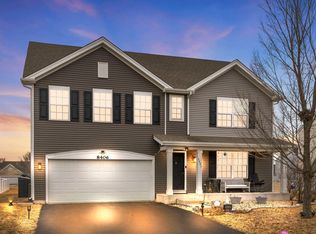
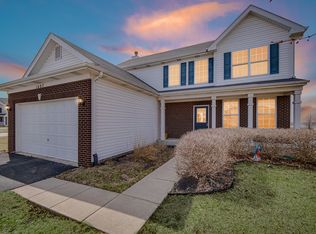
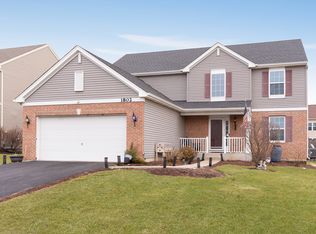
1000 Angelica Cir, Joliet, IL 60431
Off Market
Zillow last checked: 7 hours ago
Listing updated: February 27, 2026 at 04:55pm
Bobbie Soris, ABR,CSC,PSA,SFR 630-567-5779,
Realty Executives Success
Not available
Estimated sales range
Not available
Not available
| Date | Event | Price |
|---|---|---|
| 2/28/2026 | Contingent | $479,000$116/sqft |
Source: | ||
| 2/11/2026 | Listed for sale | $479,000-2.2%$116/sqft |
Source: | ||
| 12/5/2025 | Listing removed | $489,650$119/sqft |
Source: | ||
| 10/31/2025 | Listed for sale | $489,650-0.1%$119/sqft |
Source: | ||
| 10/31/2025 | Listing removed | $489,900$119/sqft |
Source: | ||
| 9/26/2025 | Price change | $489,900-2%$119/sqft |
Source: | ||
| 8/27/2025 | Listed for sale | $499,900+11.1%$121/sqft |
Source: | ||
| 6/1/2022 | Sold | $450,000+5.9%$109/sqft |
Source: | ||
| 4/13/2022 | Contingent | $424,900$103/sqft |
Source: | ||
| 4/5/2022 | Listed for sale | $424,900$103/sqft |
Source: | ||
| 3/29/2022 | Contingent | $424,900$103/sqft |
Source: MRED as distributed by MLS GRID #11356843 Report a problem | ||
| 3/25/2022 | Listed for sale | $424,900+30.7%$103/sqft |
Source: | ||
| 10/19/2018 | Sold | $325,000-7%$79/sqft |
Source: | ||
| 9/18/2018 | Pending sale | $349,500$85/sqft |
Source: Carter Realty Group #09990253 Report a problem | ||
| 8/28/2018 | Price change | $349,500-3.6%$85/sqft |
Source: Carter Realty Group #09990253 Report a problem | ||
| 7/30/2018 | Price change | $362,500-2.7%$88/sqft |
Source: Carter Realty Group #09990253 Report a problem | ||
| 6/19/2018 | Listed for sale | $372,500+46.1%$90/sqft |
Source: Carter Realty Group #09990253 Report a problem | ||
| 12/13/2013 | Sold | $255,000-1.9%$62/sqft |
Source: Public Record Report a problem | ||
| 10/18/2013 | Price change | $259,900-9.1%$63/sqft |
Source: Homepath #08446999 Report a problem | ||
| 9/18/2013 | Listed for sale | $285,900-22.1%$69/sqft |
Source: Homepath #08446999 Report a problem | ||
| 10/5/2007 | Sold | $367,000$89/sqft |
Source: Public Record Report a problem | ||
| Year | Property taxes | Tax assessment |
|---|---|---|
| 2024 | $11,835 +13.3% | $145,500 +15.3% |
| 2023 | $10,449 +11.6% | $126,168 +12.2% |
| 2022 | $9,366 +6% | $112,453 +9.9% |
| 2021 | $8,835 -0.3% | $102,325 |
| 2020 | $8,865 +2.7% | $102,325 |
| 2019 | $8,633 | $102,325 +6.4% |
| 2018 | $8,633 +120.7% | $96,167 +12.5% |
| 2017 | $3,912 +2.3% | $85,467 +3.2% |
| 2016 | $3,825 +4.4% | $82,821 +5.4% |
| 2015 | $3,666 | $78,600 +9.6% |
| 2014 | $3,666 | $71,745 |
| 2013 | -- | $71,745 -11% |
| 2012 | -- | $80,641 -7.6% |
| 2011 | -- | $87,293 -15% |
| 2010 | -- | $102,698 -6.7% |
| 2009 | -- | $110,034 |
| 2008 | -- | $110,034 +10903.4% |
| 2007 | -- | $1,000 |
| 2006 | $80 | $1,000 |
| 2005 | -- | $1,000 |
Source: MRED as distributed by MLS GRID. This data may not be complete. We recommend contacting the local school district to confirm school assignments for this home.