$391,600
2 bd|2 ba|1.2k sqft
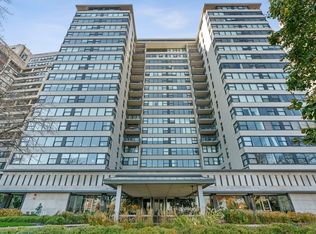
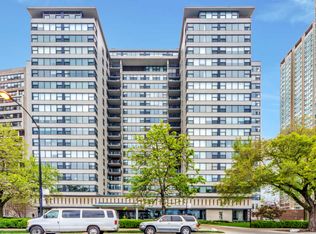
3440 N Lake Shore Dr APT 3A, Chicago, IL 60657
Off Market
Likely to sell faster than
Zillow last checked: 7 hours ago
Listing updated: April 01, 2026 at 11:43am
Alexandre Stoykov 312-319-1168,
Compass
Not available
Estimated sales range
Not available
Not available
| Date | Event | Price |
|---|---|---|
| 3/31/2026 | Listed for sale | $350,000+7.7%$292/sqft |
Source: | ||
| 5/20/2024 | Sold | $325,000-3%$271/sqft |
Source: | ||
| 5/11/2024 | Pending sale | $335,000$279/sqft |
Source: | ||
| 5/5/2024 | Contingent | $335,000$279/sqft |
Source: | ||
| 5/2/2024 | Listed for sale | $335,000-59.4%$279/sqft |
Source: | ||
| 1/30/2017 | Sold | $825,897+210.5%$688/sqft |
Source: Agent Provided Report a problem | ||
| 11/6/2014 | Sold | $266,000-4.7%$222/sqft |
Source: | ||
| 10/14/2014 | Pending sale | $279,000$233/sqft |
Source: Berkshire Hathaway HomeServices KoenigRubloff Realty Group #08742616 Report a problem | ||
| 10/3/2014 | Listed for sale | $279,000+1.8%$233/sqft |
Source: Berkshire Hathaway HomeServices KoenigRubloff Realty Group #08742616 Report a problem | ||
| 7/21/2006 | Sold | $274,000+100%$228/sqft |
Source: Public Record Report a problem | ||
| 4/20/1998 | Sold | $137,000$114/sqft |
Source: Public Record Report a problem | ||
| Year | Property taxes | Tax assessment |
|---|---|---|
| 2023 | $4,803 +3.1% | $26,079 |
| 2022 | $4,660 +1.9% | $26,079 |
| 2021 | $4,575 +7.9% | $26,079 +17.8% |
| 2020 | $4,239 +1.4% | $22,131 -8.7% |
| 2019 | $4,181 +1.7% | $24,241 |
| 2018 | $4,110 +15.6% | $24,241 +21.9% |
| 2017 | $3,556 +2.1% | $19,892 |
| 2016 | $3,484 -4.4% | $19,892 |
| 2015 | $3,645 +15.5% | $19,892 +17% |
| 2014 | $3,155 +2% | $17,006 |
| 2013 | $3,093 +1.4% | $17,006 |
| 2012 | $3,052 -22.1% | $17,006 -29.7% |
| 2011 | $3,917 -0.4% | $24,174 |
| 2010 | $3,934 +4.4% | $24,174 |
| 2009 | $3,770 +3% | $24,174 -5.3% |
| 2008 | $3,661 +1% | $25,523 |
| 2007 | $3,625 -1.1% | $25,523 |
| 2006 | $3,664 +45.7% | $25,523 +12.4% |
| 2005 | $2,515 +4% | $22,711 |
| 2004 | $2,418 -32.7% | $22,711 |
| 2003 | $3,594 +45.6% | $22,711 +65.4% |
| 2002 | $2,467 +3.8% | $13,734 |
| 2001 | $2,378 +45.1% | $13,734 |
| 2000 | $1,639 -19.5% | $13,734 +30.4% |
| 1999 | $2,037 | $10,533 |
Source: MRED as distributed by MLS GRID. This data may not be complete. We recommend contacting the local school district to confirm school assignments for this home.