$220,000
-- bd|1 ba|566 sqft
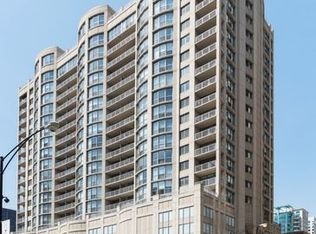
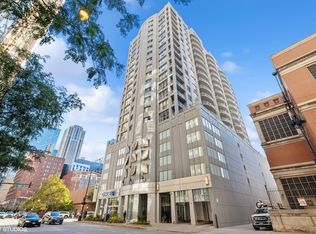
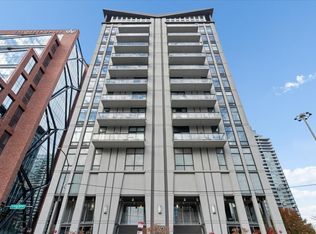
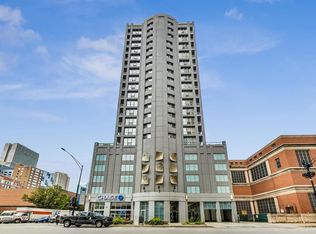
600 N Dearborn St APT 807, Chicago, IL 60654
Sold
Zillow last checked: 8 hours ago
Listing updated: February 19, 2026 at 10:17am
Melanie Everett 312-319-1168,
Compass,
Courtney Funkhouser 517-282-8408,
Compass
$337,600
$321,000 - $354,000
$2,695/mo
| Date | Event | Price |
|---|---|---|
| 2/19/2026 | Contingent | $339,900 |
Source: | ||
| 2/12/2026 | Listed for sale | $339,900-2.9% |
Source: | ||
| 2/12/2026 | Listing removed | $349,900 |
Source: | ||
| 1/21/2026 | Listed for sale | $349,900+12.9% |
Source: | ||
| 1/31/2020 | Sold | $310,000-2.8% |
Source: | ||
| 11/12/2019 | Pending sale | $319,000 |
Source: Baird & Warner #10557723 Report a problem | ||
| 11/5/2019 | Price change | $319,000-8.6% |
Source: Baird & Warner #10557723 Report a problem | ||
| 10/25/2019 | Listed for sale | $349,000+24.6% |
Source: Baird & Warner #10557723 Report a problem | ||
| 9/11/2018 | Sold | $280,000-3.4% |
Source: | ||
| 7/19/2018 | Pending sale | $289,900 |
Source: Coldwell Banker Residential Brokerage - Halsted #09993133 Report a problem | ||
| 6/21/2018 | Price change | $289,900-3.4% |
Source: Coldwell Banker Residential Brokerage - Halsted #09993133 Report a problem | ||
| 5/14/2018 | Price change | $300,000-2.9% |
Source: Coldwell Banker Residential Brokerage - Halsted #09993133 Report a problem | ||
| 4/19/2018 | Price change | $309,000-1.6% |
Source: Coldwell Banker Residential Brokerage - Halsted #09993133 Report a problem | ||
| 3/27/2018 | Listed for sale | $314,000 |
Source: Coldwell Banker Residential Brokerage - Halsted #09993133 Report a problem | ||
| Year | Property taxes | Tax assessment |
|---|---|---|
| 2023 | $4,136 +3.1% | $22,917 |
| 2022 | $4,010 +1.8% | $22,917 |
| 2021 | $3,939 -16.8% | $22,917 +7.8% |
| 2020 | $4,736 +2.1% | $21,261 -7.9% |
| 2019 | $4,640 +1.7% | $23,093 |
| 2018 | $4,562 +4.6% | $23,093 +14% |
| 2017 | $4,361 +7.5% | $20,257 |
| 2016 | $4,057 +9.3% | $20,257 |
| 2015 | $3,712 +27.9% | $20,257 +29.5% |
| 2014 | $2,903 +2% | $15,644 |
| 2013 | $2,845 +1.4% | $15,644 |
| 2012 | $2,807 -2.1% | $15,644 -11.6% |
| 2011 | $2,866 -13.9% | $17,689 -13.5% |
| 2010 | $3,329 +4.4% | $20,457 |
| 2009 | $3,190 +9.9% | $20,457 +1.1% |
| 2008 | $2,904 +1% | $20,241 |
| 2007 | $2,875 -1.1% | $20,241 |
| 2006 | $2,906 +10.6% | $20,241 +25.9% |
| 2005 | $2,627 +1% | $16,074 |
| 2004 | $2,600 +2.2% | $16,074 |
| 2003 | $2,544 | $16,074 |
Source: MRED as distributed by MLS GRID. This data may not be complete. We recommend contacting the local school district to confirm school assignments for this home.