$340,000
1 bd|1 ba|720 sqft
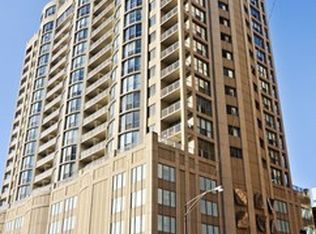
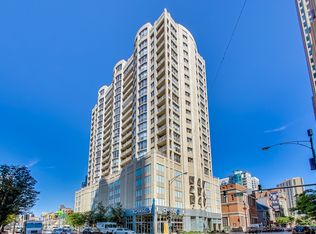
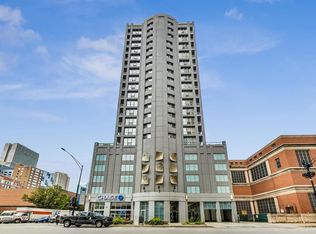
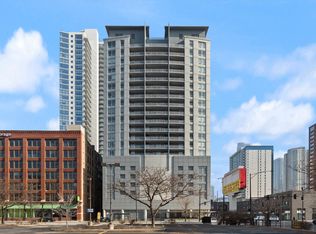
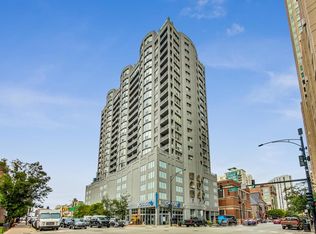
600 N Dearborn St APT 708, Chicago, IL 60654
Sold
Likely to sell faster than
Zillow last checked: 8 hours ago
Listing updated: February 18, 2026 at 09:05am
Jaclyn Manrique (773)793-8291,
Jameson Sotheby's Intl Realty
$518,700
$493,000 - $545,000
$3,750/mo
| Date | Event | Price |
|---|---|---|
| 1/29/2026 | Contingent | $525,000$463/sqft |
Source: | ||
| 1/19/2026 | Listed for sale | $525,000+31.3%$463/sqft |
Source: | ||
| 2/7/2023 | Sold | $400,000+3.9%$352/sqft |
Source: | ||
| 1/29/2023 | Contingent | $385,000$339/sqft |
Source: | ||
| 1/4/2023 | Listed for sale | $385,000-2.5%$339/sqft |
Source: | ||
| 1/4/2023 | Listing removed | -- |
Source: | ||
| 11/15/2022 | Listed for sale | $395,000$348/sqft |
Source: | ||
| 11/14/2022 | Listing removed | -- |
Source: | ||
| 8/19/2022 | Listed for sale | $395,000-8.1%$348/sqft |
Source: | ||
| 8/19/2022 | Listing removed | -- |
Source: | ||
| 8/1/2022 | Listed for sale | $430,000$379/sqft |
Source: | ||
| 8/1/2022 | Listing removed | -- |
Source: | ||
| 7/12/2022 | Listed for sale | $430,000-4.4%$379/sqft |
Source: | ||
| 7/12/2022 | Listing removed | -- |
Source: | ||
| 6/14/2022 | Listed for sale | $450,000+5.9%$396/sqft |
Source: | ||
| 8/14/2020 | Listing removed | $425,000$374/sqft |
Source: @properties #10784766 Report a problem | ||
| 7/16/2020 | Price change | $425,000-5.6%$374/sqft |
Source: @properties #10784766 Report a problem | ||
| 6/9/2020 | Listed for sale | $450,000-5.3%$396/sqft |
Source: @properties #10722241 Report a problem | ||
| 5/7/2020 | Listing removed | $475,000$419/sqft |
Source: Superior Realty Group #10475451 Report a problem | ||
| 8/6/2019 | Price change | $475,000-4%$419/sqft |
Source: Superior Realty Group #10475451 Report a problem | ||
| 5/7/2019 | Listed for sale | $495,000+2.1%$436/sqft |
Source: Superior Realty Group #10370459 Report a problem | ||
| 10/17/2018 | Listing removed | $2,850$3/sqft |
Source: Ebonie Caldwell Realty Portfolio Luxury Report a problem | ||
| 10/15/2018 | Listed for rent | $2,850$3/sqft |
Source: Ebonie Caldwell Realty Portfolio Luxury Report a problem | ||
| 3/28/2016 | Sold | $485,000+4.3%$427/sqft |
Source: | ||
| 3/10/2016 | Pending sale | $465,000$410/sqft |
Source: Related Realty #09154753 Report a problem | ||
| 3/3/2016 | Listed for sale | $465,000-2.1%$410/sqft |
Source: Related Realty #09154753 Report a problem | ||
| 9/5/2007 | Sold | $475,000+1.2%$419/sqft |
Source: Agent Provided Report a problem | ||
| 10/9/2001 | Sold | $469,500$414/sqft |
Source: Public Record Report a problem | ||
| Year | Property taxes | Tax assessment |
|---|---|---|
| 2023 | $11,241 +2.6% | $53,278 |
| 2022 | $10,958 +2.3% | $53,278 |
| 2021 | $10,714 -2.7% | $53,278 +7.8% |
| 2020 | $11,011 +2.1% | $49,429 -7.9% |
| 2019 | $10,786 +1.7% | $53,687 |
| 2018 | $10,605 +4.6% | $53,687 +14% |
| 2017 | $10,138 +13.5% | $47,096 |
| 2016 | $8,933 +9.6% | $47,096 |
| 2015 | $8,149 +29.9% | $47,096 +29.5% |
| 2014 | $6,272 +2.2% | $36,371 |
| 2013 | $6,137 +1% | $36,371 |
| 2012 | $6,079 -4.1% | $36,371 -11.6% |
| 2011 | $6,337 -14.9% | $41,125 -13.5% |
| 2010 | $7,443 +0.4% | $47,560 |
| 2009 | $7,416 +9.9% | $47,560 +1.1% |
| 2008 | $6,750 +1% | $47,057 |
| 2007 | $6,683 -1.1% | $47,057 |
| 2006 | $6,755 +10.6% | $47,057 +25.9% |
| 2005 | $6,107 +1% | $37,373 |
| 2004 | $6,045 +2.2% | $37,373 |
| 2003 | $5,914 | $37,373 |
Source: MRED as distributed by MLS GRID. This data may not be complete. We recommend contacting the local school district to confirm school assignments for this home.