$--
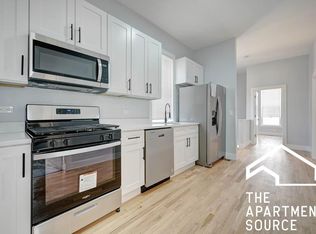
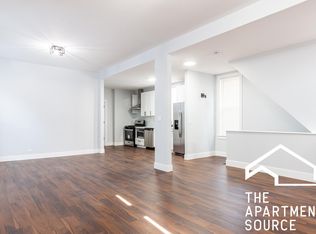
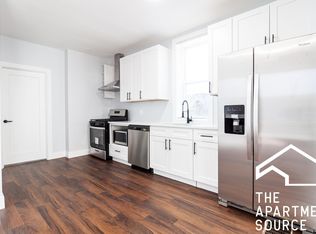
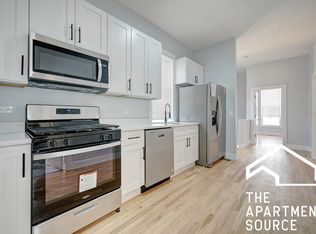
2 bd|1 ba|1.6k sqft
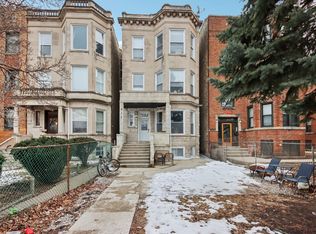
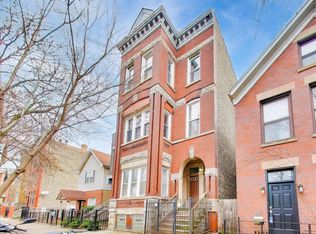
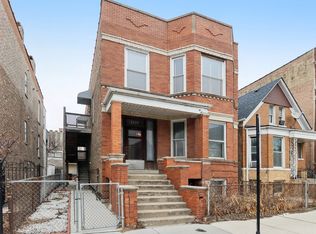
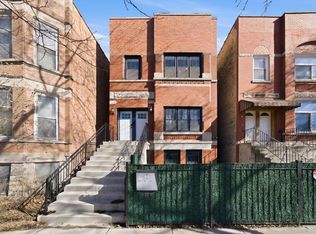
930 N Richmond St UNIT 2, Chicago, IL 60622
Off Market
Zillow last checked: 7 hours ago
Listing updated: February 22, 2026 at 10:07pm
Mitir Patel 773-305-4858,
Essex 312, LLC,
Quinn Evans 224-244-3098,
Essex 312, LLC
Not available
Estimated sales range
Not available
$3,202/mo
| Date | Event | Price |
|---|---|---|
| 2/17/2026 | Listed for sale | $1,299,000+99.8% |
Source: | ||
| 9/9/2022 | Sold | $650,000 |
Source: | ||
| 7/11/2022 | Contingent | $650,000 |
Source: | ||
| 6/29/2022 | Price change | $650,000-13.3% |
Source: | ||
| 6/14/2022 | Listed for sale | $750,000 |
Source: | ||
| 5/17/2022 | Contingent | $750,000 |
Source: | ||
| 5/17/2022 | Listed for sale | $750,000 |
Source: | ||
| 4/30/2022 | Contingent | $750,000 |
Source: | ||
| 4/27/2022 | Listed for sale | $750,000+73.4% |
Source: | ||
| 1/23/2020 | Listing removed | $450 |
Source: Greystone Properties, Inc. Report a problem | ||
| 1/20/2020 | Listed for rent | $450+12.5% |
Source: Greystone Properties, Inc. Report a problem | ||
| 2/13/2019 | Listing removed | $400 |
Source: Greystone Properties, Inc. Report a problem | ||
| 2/10/2019 | Listed for rent | $400 |
Source: Greystone Properties, Inc. Report a problem | ||
| 11/16/2001 | Sold | $432,500+208.9% |
Source: Public Record Report a problem | ||
| 1/8/1997 | Sold | $140,000 |
Source: Public Record Report a problem | ||
| Year | Property taxes | Tax assessment |
|---|---|---|
| 2023 | $17,203 -5.7% | $81,289 -8.3% |
| 2022 | $18,238 +2.3% | $88,670 |
| 2021 | $17,831 +75.4% | $88,670 +94.3% |
| 2020 | $10,165 -2.4% | $45,631 -12% |
| 2019 | $10,418 +1.7% | $51,854 |
| 2018 | $10,243 -1.1% | $51,854 +7.7% |
| 2017 | $10,361 +7.5% | $48,128 |
| 2016 | $9,639 +9.3% | $48,128 |
| 2015 | $8,819 +17% | $48,128 +18.5% |
| 2014 | $7,537 +2% | $40,622 |
| 2013 | $7,388 -1.5% | $40,622 -2.8% |
| 2012 | $7,498 -2.4% | $41,785 -15.2% |
| 2009 | $7,679 +3.9% | $49,246 -4.4% |
| 2008 | $7,391 -5.5% | $51,525 -6.4% |
| 2007 | $7,822 -1.1% | $55,076 |
| 2006 | $7,907 +61.8% | $55,076 +82.3% |
| 2004 | $4,887 +2.2% | $30,215 |
| 2003 | $4,781 +23.5% | $30,215 +40.2% |
| 2002 | $3,872 +14.5% | $21,553 |
| 2001 | $3,382 +53.5% | $21,553 |
| 2000 | $2,204 -15.4% | $21,553 +60% |
| 1999 | $2,605 | $13,471 |
Source: MRED as distributed by MLS GRID. This data may not be complete. We recommend contacting the local school district to confirm school assignments for this home.