$320,000
2 bd|2 ba|1k sqft
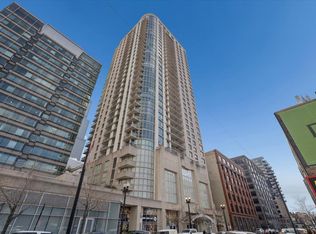
8 W Monroe St APT 1809, Chicago, IL 60603
Off Market

Zillow last checked: 8 hours ago
Listing updated: March 06, 2026 at 04:53pm
Adam Max 847-361-3756,
Compass
$213,700
$203,000 - $224,000
$2,633/mo
| Date | Event | Price |
|---|---|---|
| 3/3/2026 | Listing removed | $2,500$3/sqft |
Source: MRED as distributed by MLS GRID #12572709 Report a problem | ||
| 2/19/2026 | Listed for rent | $2,500+47.1%$3/sqft |
Source: MRED as distributed by MLS GRID #12572709 Report a problem | ||
| 2/10/2026 | Price change | $215,000-4.4%$257/sqft |
Source: | ||
| 1/14/2026 | Listed for sale | $225,000-10%$269/sqft |
Source: | ||
| 1/14/2026 | Listing removed | $250,000$299/sqft |
Source: | ||
| 12/2/2025 | Listed for sale | $250,000+20.8%$299/sqft |
Source: | ||
| 4/26/2022 | Sold | $207,000+1.5%$248/sqft |
Source: | ||
| 7/1/2019 | Sold | $204,000+2.5%$244/sqft |
Source: | ||
| 6/5/2019 | Pending sale | $199,000$238/sqft |
Source: @properties #10377031 Report a problem | ||
| 5/29/2019 | Price change | $199,000-7.4%$238/sqft |
Source: @properties #10377031 Report a problem | ||
| 5/13/2019 | Price change | $214,9000%$257/sqft |
Source: @properties #10377031 Report a problem | ||
| 5/15/2018 | Price change | $215,000-4.4%$257/sqft |
Source: @properties #09923448 Report a problem | ||
| 4/20/2018 | Listed for sale | $225,000-2.2%$269/sqft |
Source: @properties #09923448 Report a problem | ||
| 5/10/2016 | Listing removed | $1,699+6.2%$2/sqft |
Source: @properties #09208256 Report a problem | ||
| 7/19/2013 | Listed for rent | $1,600+6.7%$2/sqft |
Source: @properties #08397255 Report a problem | ||
| 8/17/2011 | Listing removed | $1,500$2/sqft |
Source: @properties #07878836 Report a problem | ||
| 8/12/2011 | Listed for rent | $1,500$2/sqft |
Source: @properties #07878836 Report a problem | ||
| 8/10/2006 | Sold | $230,000$275/sqft |
Source: Public Record Report a problem | ||
| Year | Property taxes | Tax assessment |
|---|---|---|
| 2023 | $4,030 +26.7% | $18,256 |
| 2022 | $3,180 +1.8% | $18,256 |
| 2021 | $3,124 -20.4% | $18,256 +7.5% |
| 2020 | $3,924 +1.4% | $16,976 -8.2% |
| 2019 | $3,868 +1.7% | $18,489 |
| 2018 | $3,802 +20.4% | $18,489 +31.4% |
| 2017 | $3,158 +6.9% | $14,070 |
| 2016 | $2,953 +9% | $14,070 |
| 2015 | $2,708 +13% | $14,070 +15.4% |
| 2014 | $2,396 +2% | $12,194 |
| 2013 | $2,349 +1% | $12,194 |
| 2012 | $2,327 -25.1% | $12,194 -31.7% |
| 2011 | $3,108 | $17,854 |
Source: MRED as distributed by MLS GRID. This data may not be complete. We recommend contacting the local school district to confirm school assignments for this home.