$167,800
3 bd|1 ba|1k sqft
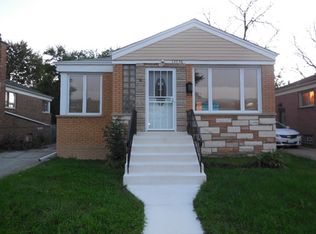
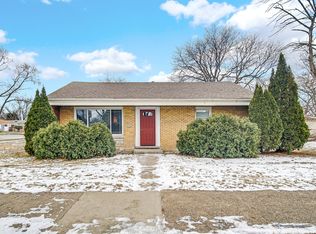
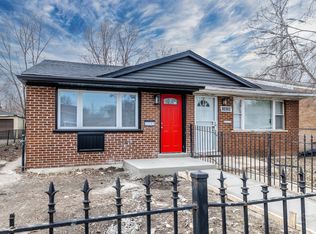
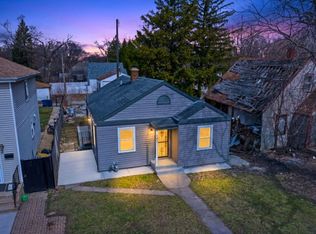
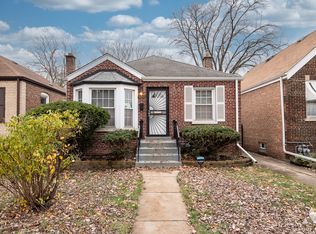
12732 S May St, Calumet Park, IL 60827
Off Market
Zillow last checked: 7 hours ago
Listing updated: April 04, 2026 at 10:06pm
Kimberly Litke 708-516-5236,
Baird & Warner
Not available
Estimated sales range
Not available
Not available
| Date | Event | Price |
|---|---|---|
| 3/31/2026 | Listed for sale | $179,900+9.2%$176/sqft |
Source: | ||
| 12/30/2023 | Listing removed | -- |
Source: Zillow Rentals Report a problem | ||
| 12/6/2023 | Listed for rent | $1,850$2/sqft |
Source: Zillow Rentals Report a problem | ||
| 12/6/2023 | Listing removed | -- |
Source: | ||
| 11/21/2023 | Price change | $164,800-0.1%$161/sqft |
Source: | ||
| 10/11/2023 | Price change | $164,900-2.9%$161/sqft |
Source: | ||
| 9/30/2023 | Listed for sale | $169,900$166/sqft |
Source: | ||
| 9/30/2023 | Listing removed | -- |
Source: | ||
| 7/6/2023 | Contingent | $169,900$166/sqft |
Source: | ||
| 7/1/2023 | Listed for sale | $169,900$166/sqft |
Source: | ||
| 6/30/2023 | Listing removed | -- |
Source: | ||
| 6/21/2023 | Contingent | $169,900$166/sqft |
Source: | ||
| 6/9/2023 | Listed for sale | $169,900+100.8%$166/sqft |
Source: | ||
| 1/9/2023 | Sold | $84,601-15.3%$83/sqft |
Source: | ||
| 12/16/2022 | Pending sale | $99,900$98/sqft |
Source: | ||
| 12/16/2022 | Price change | $99,900$98/sqft |
Source: | ||
| 10/29/2022 | Listed for sale | -- |
Source: | ||
| Year | Property taxes | Tax assessment |
|---|---|---|
| 2023 | $5,531 +17.1% | $11,000 +49.6% |
| 2022 | $4,724 +3.7% | $7,354 |
| 2021 | $4,555 +1.7% | $7,354 |
| 2020 | $4,480 -15.6% | $7,354 -20.9% |
| 2019 | $5,309 -1.6% | $9,293 |
| 2018 | $5,393 +3.7% | $9,293 |
| 2017 | $5,200 +10.2% | $9,293 +5.1% |
| 2016 | $4,717 +4.3% | $8,839 |
| 2015 | $4,522 -1.2% | $8,839 |
| 2014 | $4,575 +3.2% | $8,839 -11% |
| 2013 | $4,435 +1.7% | $9,936 |
| 2012 | $4,360 +8.1% | $9,936 |
| 2011 | $4,034 -11.8% | $9,936 -19.4% |
| 2010 | $4,575 +2.9% | $12,323 |
| 2009 | $4,447 +6.6% | $12,323 -7% |
| 2008 | $4,172 +18.8% | $13,251 +21.9% |
| 2007 | $3,513 +3.5% | $10,869 |
| 2006 | $3,393 +0.7% | $10,869 |
| 2005 | $3,369 +15.9% | $10,869 +20.4% |
| 2004 | $2,906 +4.8% | $9,030 |
| 2003 | $2,774 +5.8% | $9,030 |
| 2002 | $2,622 +16.6% | $9,030 +16.4% |
| 2001 | $2,247 +3.8% | $7,759 |
| 2000 | $2,166 +50.6% | $7,759 |
| 1999 | $1,439 | $7,759 |
Source: MRED as distributed by MLS GRID. This data may not be complete. We recommend contacting the local school district to confirm school assignments for this home.