$252,700
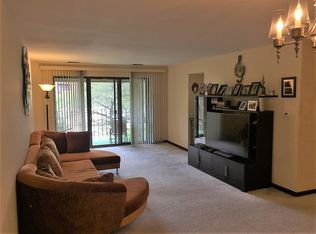
2 bd|2 ba|1.2k sqft
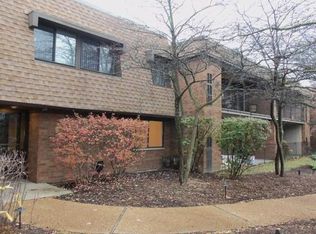
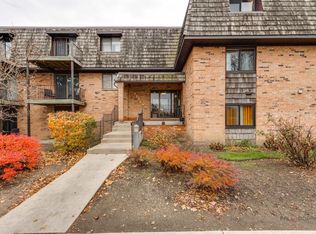
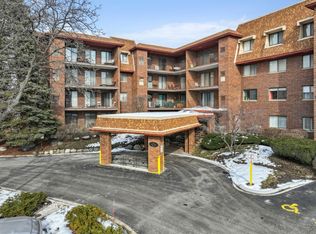
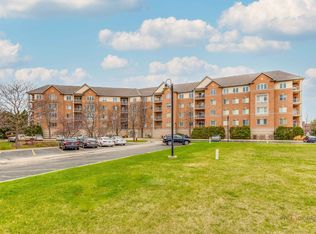
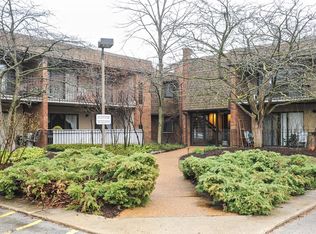
30 Old Oak Dr APT 208, Buffalo Grove, IL 60089
Off Market
Zillow last checked: 7 hours ago
Listing updated: 12 hours ago
Alexander Benisin 224-392-8393,
Ben & Heller Realty LLC
Not available
Estimated sales range
Not available
Not available
| Date | Event | Price |
|---|---|---|
| 4/3/2026 | Listed for sale | $239,000+29.3%$163/sqft |
Source: | ||
| 9/21/2019 | Listing removed | $184,900$126/sqft |
Source: Core Realty & Investments Inc #10386993 Report a problem | ||
| 9/7/2019 | Price change | $184,900-2.6%$126/sqft |
Source: Core Realty & Investments Inc #10386993 Report a problem | ||
| 8/21/2019 | Pending sale | $189,900$129/sqft |
Source: Core Realty & Investments Inc #10386993 Report a problem | ||
| 5/21/2019 | Price change | $189,900-2.6%$129/sqft |
Source: Core Realty & Investments Inc #10386993 Report a problem | ||
| 4/23/2019 | Listed for sale | $194,900+18.1%$133/sqft |
Source: Core Realty & Investments Inc #10386993 Report a problem | ||
| 3/26/2018 | Sold | $165,000-2.9%$112/sqft |
Source: | ||
| 2/8/2018 | Pending sale | $169,900$116/sqft |
Source: Baird & Warner #09830505 Report a problem | ||
| 1/10/2018 | Price change | $169,900-2.9%$116/sqft |
Source: Baird & Warner #09830505 Report a problem | ||
| 11/30/2017 | Price change | $174,900-2.8%$119/sqft |
Source: Baird & Warner #09830505 Report a problem | ||
| 11/10/2017 | Listed for sale | $179,900+69.7%$122/sqft |
Source: Baird & Warner #09830505 Report a problem | ||
| 9/30/2014 | Sold | $106,000-37.5%$72/sqft |
Source: | ||
| 5/14/2003 | Sold | $169,500+64.6%$115/sqft |
Source: Public Record Report a problem | ||
| 11/26/1996 | Sold | $103,000$70/sqft |
Source: Public Record Report a problem | ||
| Year | Property taxes | Tax assessment |
|---|---|---|
| 2023 | $4,176 +4.8% | $16,362 |
| 2022 | $3,985 +15% | $16,362 +24.5% |
| 2021 | $3,467 +0.4% | $13,143 |
| 2020 | $3,452 -23.5% | $13,143 -9.8% |
| 2019 | $4,510 +149.4% | $14,565 +67.7% |
| 2018 | $1,808 -38.4% | $8,685 |
| 2017 | $2,936 +7.6% | $8,685 |
| 2016 | $2,728 -21.6% | $8,685 -15.2% |
| 2015 | $3,481 +35.7% | $10,246 |
| 2014 | $2,565 +9% | $10,246 |
| 2013 | $2,352 +8% | $10,246 +2.5% |
| 2012 | $2,178 -41.6% | $9,992 -35.8% |
| 2011 | $3,727 +20.6% | $15,555 |
| 2010 | $3,092 -1.2% | $15,555 -16.9% |
| 2009 | $3,131 +29% | $18,722 -7% |
| 2008 | $2,426 +7.8% | $20,132 |
| 2007 | $2,250 -2.6% | $20,132 +35.1% |
| 2006 | $2,311 +8.8% | $14,901 |
| 2005 | $2,123 +5.8% | $14,901 |
| 2004 | $2,007 -1.3% | $14,901 +31.1% |
| 2003 | $2,034 -10.2% | $11,367 |
| 2002 | $2,265 +31.9% | $11,367 |
| 2001 | $1,718 +2.6% | $11,367 +5.7% |
| 2000 | $1,675 +2.8% | $10,750 |
| 1999 | $1,629 | $10,750 |
Source: MRED as distributed by MLS GRID. This data may not be complete. We recommend contacting the local school district to confirm school assignments for this home.