$341,500
-- bd|-- ba|-- sqft
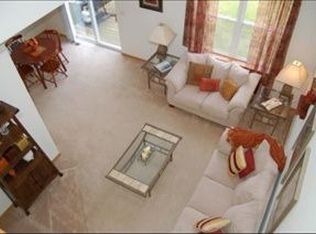
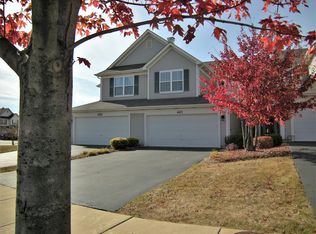
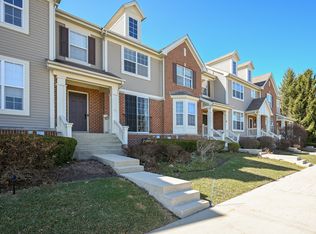
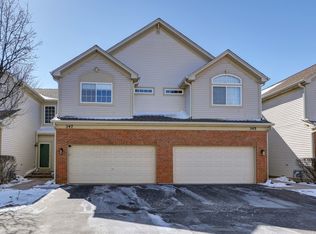
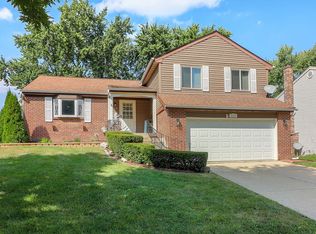
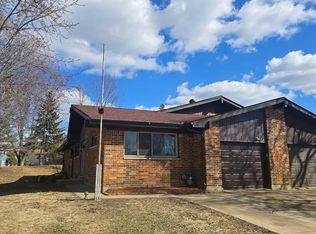
535 Horizon Dr, Bartlett, IL 60103
Off Market
Likely to sell faster than
Zillow last checked: 7 hours ago
Listing updated: March 08, 2026 at 05:37am
Daniel Nierman 847-601-9359,
4 Sale Realty Advantage LLC
Not available
Estimated sales range
Not available
Not available
| Date | Event | Price |
|---|---|---|
| 3/8/2026 | Contingent | $375,000$221/sqft |
Source: | ||
| 3/3/2026 | Listed for sale | $375,000+7.2%$221/sqft |
Source: | ||
| 9/1/2023 | Sold | $349,900+1.4%$206/sqft |
Source: | ||
| 8/13/2023 | Pending sale | $344,900$203/sqft |
Source: | ||
| 8/2/2023 | Listing removed | -- |
Source: | ||
| 7/26/2023 | Listed for sale | $344,900+60.4%$203/sqft |
Source: | ||
| 7/26/2017 | Sold | $215,000$126/sqft |
Source: Public Record Report a problem | ||
| 6/19/2017 | Sold | $215,000-4%$126/sqft |
Source: | ||
| 5/2/2017 | Pending sale | $223,900$132/sqft |
Source: Glen Ellyn #09607683 Report a problem | ||
| 4/27/2017 | Price change | $223,900+6.9%$132/sqft |
Source: Keller Williams Premiere Properties #09607683 Report a problem | ||
| 7/21/2012 | Listed for sale | $209,500-2.5%$123/sqft |
Source: Prudential Starck Realtors #08119445 Report a problem | ||
| 8/3/2011 | Listing removed | $214,900$126/sqft |
Source: RE/MAX #07785090 Report a problem | ||
| 5/17/2011 | Price change | $214,900-2.3%$126/sqft |
Source: RE/MAX All Pro #07785090 Report a problem | ||
| 4/21/2011 | Listed for sale | $219,900+18.9%$129/sqft |
Source: Visual Tour #07785090 Report a problem | ||
| 10/27/2000 | Sold | $185,000$109/sqft |
Source: Public Record Report a problem | ||
| Year | Property taxes | Tax assessment |
|---|---|---|
| 2023 | $5,652 +4.1% | $21,171 |
| 2022 | $5,429 +15.1% | $21,171 +32.1% |
| 2021 | $4,716 -0.4% | $16,021 |
| 2020 | $4,736 -19.7% | $16,021 -10.9% |
| 2019 | $5,899 +13.5% | $17,990 +23.8% |
| 2018 | $5,196 +1.7% | $14,536 |
| 2017 | $5,109 +7.1% | $14,536 |
| 2016 | $4,770 -5.2% | $14,536 +2.4% |
| 2015 | $5,035 +1.3% | $14,195 |
| 2014 | $4,971 +4% | $14,195 |
| 2013 | $4,780 -6.9% | $14,195 -15.3% |
| 2012 | $5,132 +24% | $16,762 |
| 2011 | $4,139 +2.8% | $16,762 |
| 2010 | $4,027 +3.1% | $16,762 -9.4% |
| 2009 | $3,907 +1.2% | $18,501 -7% |
| 2008 | $3,861 +3.6% | $19,894 -7.1% |
| 2007 | $3,727 +12% | $21,420 +28.7% |
| 2006 | $3,329 +2.3% | $16,645 |
| 2005 | $3,253 +1% | $16,645 |
| 2004 | $3,220 -6.9% | $16,645 |
| 2003 | $3,458 | $16,645 |
Source: MRED as distributed by MLS GRID. This data may not be complete. We recommend contacting the local school district to confirm school assignments for this home.