$428,700
3 bd|2 ba|1.1k sqft
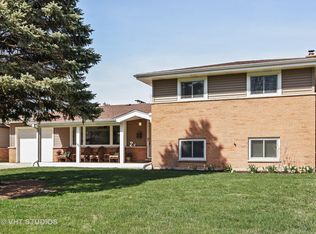
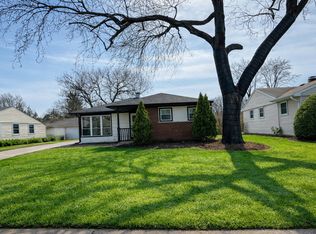
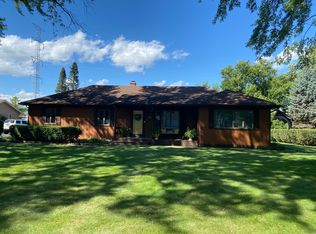
16 N Waterman Ave, Arlington Heights, IL 60004
Off Market
Zillow last checked: 7 hours ago
Listing updated: March 06, 2026 at 06:06pm
Kathy Barcham 773-339-7743,
HomeSmart Connect LLC
Not available
Estimated sales range
Not available
Not available
| Date | Event | Price |
|---|---|---|
| 3/7/2026 | Contingent | $587,500$301/sqft |
Source: | ||
| 2/17/2026 | Listed for sale | $587,500-0.4%$301/sqft |
Source: | ||
| 2/3/2026 | Listing removed | $590,000$303/sqft |
Source: | ||
| 1/15/2026 | Listed for sale | $590,000+66.2%$303/sqft |
Source: | ||
| 8/12/2016 | Sold | $355,000$182/sqft |
Source: Public Record Report a problem | ||
| 5/31/2016 | Sold | $355,000-5.3%$182/sqft |
Source: | ||
| 3/28/2016 | Pending sale | $374,900$192/sqft |
Source: Baird & Warner #09168310 Report a problem | ||
| 3/25/2016 | Price change | $374,900-1.3%$192/sqft |
Source: Baird & Warner #09168310 Report a problem | ||
| 3/17/2016 | Listed for sale | $379,900-3.8%$195/sqft |
Source: Baird & Warner #09168310 Report a problem | ||
| 6/10/2009 | Listing removed | $394,900$203/sqft |
Source: Prudential Real Estate #07132759 Report a problem | ||
| 5/3/2009 | Price change | $394,900-1.3%$203/sqft |
Source: Prudential Real Estate #07132759 Report a problem | ||
| 4/10/2009 | Price change | $399,900-2.4%$205/sqft |
Source: Prudential Real Estate #07132759 Report a problem | ||
| 2/13/2009 | Price change | $409,900-4.7%$210/sqft |
Source: Prudential Real Estate #07132759 Report a problem | ||
| 11/17/2008 | Price change | $429,900-2.3%$220/sqft |
Source: Prudential Real Estate #07132759 Report a problem | ||
| 9/23/2008 | Listed for sale | $439,900+95.5%$226/sqft |
Source: Prudential Real Estate #07132759 Report a problem | ||
| 6/3/1998 | Sold | $225,000$115/sqft |
Source: Public Record Report a problem | ||
| Year | Property taxes | Tax assessment |
|---|---|---|
| 2023 | $9,769 +4.1% | $39,000 |
| 2022 | $9,381 +17.6% | $39,000 +30.7% |
| 2021 | $7,977 +1.8% | $29,830 |
| 2020 | $7,837 +0.1% | $29,830 -10.3% |
| 2019 | $7,831 -5.7% | $33,256 +4.3% |
| 2018 | $8,301 +1% | $31,882 |
| 2017 | $8,221 +4% | $31,882 |
| 2016 | $7,904 +5.9% | $31,882 +14.3% |
| 2015 | $7,462 +2.8% | $27,894 |
| 2014 | $7,260 +2.8% | $27,894 |
| 2013 | $7,060 -7% | $27,894 -12.2% |
| 2012 | $7,595 +3.1% | $31,787 |
| 2011 | $7,366 +11% | $31,787 |
| 2010 | $6,638 -2.1% | $31,787 -11.6% |
| 2009 | $6,778 +10.4% | $35,965 -7% |
| 2008 | $6,141 +11.6% | $38,672 |
| 2007 | $5,504 +0.7% | $38,672 +26.4% |
| 2006 | $5,467 +8.8% | $30,593 |
| 2005 | $5,025 +7.1% | $30,593 |
| 2004 | $4,691 -3.7% | $30,593 +25.8% |
| 2003 | $4,869 +3.2% | $24,325 |
| 2002 | $4,719 +18% | $24,325 |
| 2001 | $4,001 +1.7% | $24,325 +24% |
| 2000 | $3,933 +1.5% | $19,616 |
| 1999 | $3,876 | $19,616 |
Source: MRED as distributed by MLS GRID. This data may not be complete. We recommend contacting the local school district to confirm school assignments for this home.