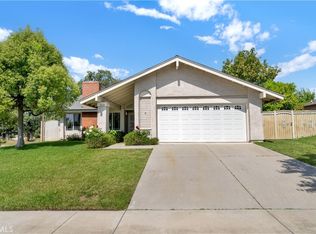
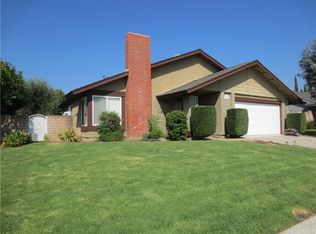
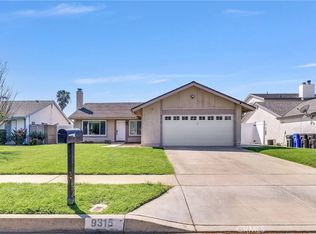
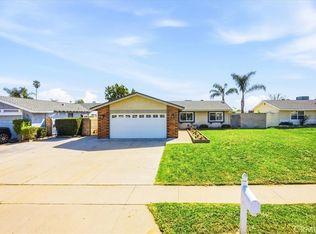
This 1552 square foot single family home has 3 bedrooms and 2.0 bathrooms. This home is located at 9990 Norwick St, Rancho Cucamonga, CA 91730.
Pre-foreclosure
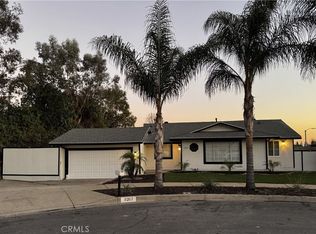
Street View
Est. $718,800
9990 Norwick St, Rancho Cucamonga, CA 91730
3beds
2baths
1,552sqft
SingleFamily
Built in 1978
9,060 Square Feet Lot
$718,800 Zestimate®
$463/sqft
$-- HOA
Overview
- 223 days |
- 36 |
- 1 |
Facts & features
Interior
Bedrooms & bathrooms
- Bedrooms: 3
- Bathrooms: 2
Heating
- Other
Cooling
- Central
Features
- Has fireplace: Yes
Interior area
- Total interior livable area: 1,552 sqft
Property
Parking
- Parking features: Garage - Attached
Features
- Has spa: Yes
Lot
- Size: 9,060 Square Feet
Details
- Parcel number: 1077351420000
Construction
Type & style
- Home type: SingleFamily
Materials
- wood frame
Condition
- Year built: 1978
Community & HOA
Location
- Region: Rancho Cucamonga
Financial & listing details
- Price per square foot: $463/sqft
- Tax assessed value: $275,827
- Annual tax amount: $5,886
Visit our professional directory to find a foreclosure specialist in your area that can help with your home search.
Find a foreclosure agentForeclosure details
Estimated market value
$718,800
$683,000 - $755,000
$3,319/mo
Price history
Price history
Price history is unavailable.
Public tax history
Public tax history
| Year | Property taxes | Tax assessment |
|---|---|---|
| 2025 | $5,886 +1.4% | $275,827 +2% |
| 2024 | $5,805 +1.1% | $270,419 +2% |
| 2023 | $5,740 +1% | $265,117 +2% |
| 2022 | $5,683 +0% | $259,919 +2% |
| 2021 | $5,681 +1.4% | $254,822 +1% |
| 2020 | $5,600 +0.3% | $252,209 +2% |
| 2019 | $5,585 +1.4% | $247,264 +2% |
| 2018 | $5,508 +111.3% | $242,416 +2% |
| 2017 | $2,606 | $237,663 +2% |
| 2016 | $2,606 +1.2% | $233,003 +1.5% |
| 2015 | $2,574 +1.1% | $229,503 +2% |
| 2014 | $2,546 | $225,007 +0.5% |
| 2013 | -- | $223,990 +2% |
| 2012 | -- | $219,598 +2% |
| 2011 | -- | $215,292 +0.8% |
| 2010 | -- | $213,682 -0.2% |
| 2009 | -- | $214,190 +2% |
| 2008 | -- | $209,990 -36.5% |
| 2007 | -- | $330,918 +64% |
| 2006 | -- | $201,836 +2% |
| 2005 | -- | $197,878 +2% |
| 2004 | -- | $193,998 +1.9% |
| 2003 | -- | $190,443 +2% |
| 2002 | -- | $186,709 +2% |
| 2001 | -- | $183,048 +13.6% |
| 2000 | -- | $161,100 |
Find assessor info on the county website
BuyAbility℠ payment
Estimated monthly payment
All calculations are estimates and provided by Zillow, Inc. for informational purposes only. Actual amounts may vary.
HOA fees may include property taxes on listings classified as Co-Ops. Contact the listing agent and/or owner for fee details.
Mortgage interest rates are dependent on a number of factors, including credit score, down payment, and repayment length. Interest rate data provided by Zillow Group Marketplace, Inc. as of 1/1/1970 from various mortgage lenders with which we have lead or other similar arrangements; the Estimated Payment is an average of those rates.
See how much you could borrow to make a competitive offer.
Boost your down payment with 6% savings match
Earn up to a 6% match & get a competitive APY with a *. Zillow has partnered with to help get you home faster.
Learn more*Terms apply. Match provided by Foyer. Account offered by Pacific West Bank, Member FDIC.Climate risks
Neighborhood: Archibald
Nearby schools
GreatSchools rating
- 5/10Dona Merced Elementary SchoolGrades: K-5Distance: 0.6 mi
- 6/10Ruth Musser Middle SchoolGrades: 5-8Distance: 1 mi
- 8/10Rancho Cucamonga High SchoolGrades: 9-12Distance: 2.6 mi
Nearby cities
Nearby neighborhoods
Nearby zip codes
Other Rancho Cucamonga Topics
- Apartments for Rent in 91730
- Houses for Sale in 91730
- Houses for Rent in 91730
- 91730 Real Estate
- Rancho Cucamonga Condos
- Houses for Sale in Rancho Cucamonga
- Newest Listings in Rancho Cucamonga
- Rancho Cucamonga Home Values
- Rancho Cucamonga Real Estate Agents
- Rancho Cucamonga Refinance
- Rancho Cucamonga Mortgage Rates