FABULOUS FUN FAMILY HOME WITH POOL! 5 BEDROOMS, ONE ON MAIN LEVEL WITH FULL BATH, LARGE LUXURY MASTER IS UP, WITH REMAINING BEDROOMS AND LOFT AREA, GREAT FOR STUDENTS WITH BUILT IN DESKS FOR COMPUTER AND STUDY. SKYLIGHTS, NEWER LIGHTING AND CEILING FANS, NEW ENERGY EFFICIENT DUAL WINDOWS INSTALLED 3 YRS AGO. GRANITE COUNTERTOPS IN KITCHEN AND MATCHING GRANITE ON THE FIREPLACE IN FAMILY ROOM. LEVEL ENTRY INTO 2 CAR GARAGE WITH BONUS STORAGE AREA. BUYER TO VERIFY SQUARE FOOTAGE. Brokered And Advertised By: CAPRE Listing Agent: NANCY RAMSEY
Pre-foreclosure
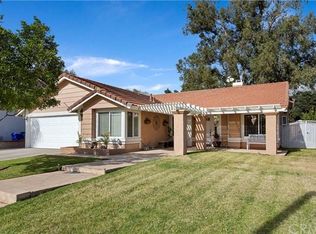
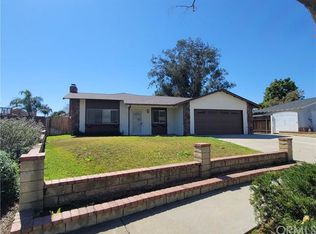
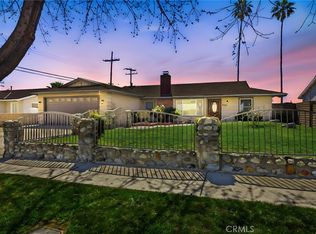
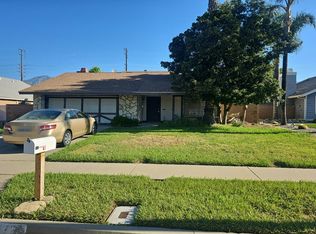
Street View
Est. $895,900
9936 Mangrove St, Rancho Cucamonga, CA 91730
5beds
3baths
2,527sqft
SingleFamily
Built in 1988
7,405 Square Feet Lot
$895,900 Zestimate®
$355/sqft
$-- HOA
Overview
- 295 days |
- 38 |
- 0 |
Facts & features
Interior
Bedrooms & bathrooms
- Bedrooms: 5
- Bathrooms: 3
Heating
- Other
Cooling
- Central
Features
- Flooring: Carpet, Laminate
- Has fireplace: Yes
Interior area
- Total interior livable area: 2,527 sqft
Property
Parking
- Total spaces: 2
- Parking features: Garage - Attached
Features
- Has view: Yes
- View description: Mountain
Lot
- Size: 7,405 Square Feet
Details
- Parcel number: 1077301430000
Construction
Type & style
- Home type: SingleFamily
Materials
- wood frame
- Roof: Other
Condition
- Year built: 1988
Community & HOA
Location
- Region: Rancho Cucamonga
Financial & listing details
- Price per square foot: $355/sqft
- Tax assessed value: $570,879
- Annual tax amount: $6,509
Visit our professional directory to find a foreclosure specialist in your area that can help with your home search.
Find a foreclosure agentForeclosure details
Estimated market value
$895,900
$851,000 - $941,000
$3,447/mo
Price history
Price history
| Date | Event | Price |
|---|---|---|
| 1/22/2015 | Sold | $475,000-2.1%$188/sqft |
Source: Public Record Report a problem | ||
| 12/3/2014 | Pending sale | $485,000$192/sqft |
Source: Corcoran Group of California Inc. #EV14189031 Report a problem | ||
| 11/15/2014 | Price change | $485,000-2.8%$192/sqft |
Source: Corcoran Group of California Inc. #EV14189031 Report a problem | ||
| 10/28/2014 | Price change | $499,000-2%$197/sqft |
Source: Corcoran Group of California Inc. #EV14189031 Report a problem | ||
| 10/7/2014 | Price change | $509,000-1.9%$201/sqft |
Source: Corcoran Group of California Inc. #EV14189031 Report a problem | ||
| 9/9/2014 | Price change | $519,000-1.9%$205/sqft |
Source: Corcoran Group of California Inc. #EV14189031 Report a problem | ||
| 9/3/2014 | Listed for sale | $529,000-3.6%$209/sqft |
Source: Corcoran Group of California Inc. #EV14189031 Report a problem | ||
| 5/14/2014 | Listing removed | $549,000$217/sqft |
Source: Realty World ALL STARS #CV14023644 Report a problem | ||
| 2/5/2014 | Listed for sale | $549,000$217/sqft |
Source: Realty World ALL STARS #CV14023644 Report a problem | ||
Public tax history
Public tax history
| Year | Property taxes | Tax assessment |
|---|---|---|
| 2025 | $6,509 +2.7% | $570,879 +2% |
| 2024 | $6,341 +2.2% | $559,686 +2% |
| 2023 | $6,207 +1.6% | $548,711 +2% |
| 2022 | $6,110 +0% | $537,952 +2% |
| 2021 | $6,109 +2.9% | $527,404 +1% |
| 2020 | $5,939 +0.5% | $521,996 +2% |
| 2019 | $5,912 +2.8% | $511,761 +2% |
| 2018 | $5,750 +1.8% | $501,726 +2% |
| 2017 | $5,649 | $491,889 +2% |
| 2016 | $5,649 +1.2% | $482,244 +7.2% |
| 2015 | $5,584 +6.5% | $449,854 +2% |
| 2014 | $5,244 | $441,042 +0.5% |
| 2013 | -- | $439,049 +2% |
| 2012 | -- | $430,440 +2% |
| 2011 | -- | $422,000 +57% |
| 2010 | -- | $268,862 -0.2% |
| 2009 | -- | $269,500 +2% |
| 2008 | -- | $264,215 +2% |
| 2007 | -- | $259,034 +2% |
| 2006 | -- | $253,955 +2% |
| 2005 | -- | $248,976 +2% |
| 2004 | -- | $244,094 +12.3% |
| 2003 | -- | $217,330 |
| 2002 | -- | $217,330 +8.2% |
| 2001 | -- | $200,950 |
| 2000 | -- | $200,950 |
Find assessor info on the county website
Monthly payment
Estimated monthly payment
All calculations are estimates and provided by Zillow, Inc. for informational purposes only. Actual amounts may vary.
HOA fees may include property taxes on listings classified as Co-Ops. Contact the listing agent and/or owner for fee details.
Mortgage interest rates are dependent on a number of factors, including credit score, down payment, and repayment length. Interest rate data provided by Zillow Group Marketplace, Inc. as of 1/1/1970 from various mortgage lenders with which we have lead or other similar arrangements; the Estimated Payment is an average of those rates.
See how much you could borrow to make a competitive offer.
Climate risks
Neighborhood: Church Street Park
Nearby schools
GreatSchools rating
- 5/10Dona Merced Elementary SchoolGrades: K-5Distance: 0.5 mi
- 6/10Ruth Musser Middle SchoolGrades: 5-8Distance: 1 mi
- 8/10Rancho Cucamonga High SchoolGrades: 9-12Distance: 2.5 mi
Nearby cities
Nearby neighborhoods
Nearby zip codes
Other Rancho Cucamonga Topics
- Apartments for Rent in 91730
- Houses for Sale in 91730
- Houses for Rent in 91730
- 91730 Real Estate
- Rancho Cucamonga Condos
- Houses for Sale in Rancho Cucamonga
- Newest Listings in Rancho Cucamonga
- Rancho Cucamonga Home Values
- Rancho Cucamonga Real Estate Agents
- Rancho Cucamonga Refinance
- Rancho Cucamonga Mortgage Rates
