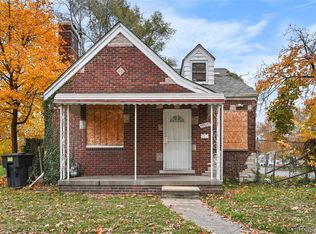
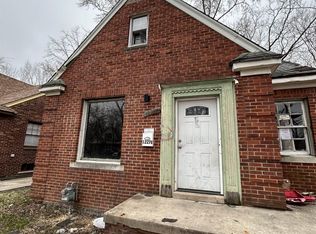
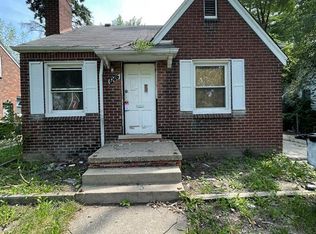
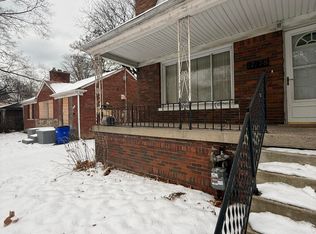
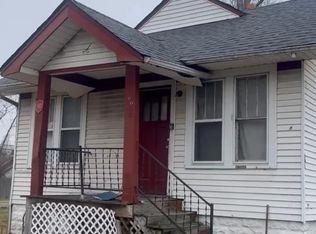
Investment opportunity on Detroit's East Side. 3 BR brick bungalow with full basement on corner lot. Some rehab required. Cash buyers only.
For sale
$50,000
9803 Nottingham Rd, Detroit, MI 48224
3beds
971sqft
Est.:
Single Family Residence
Built in 1938
3,484.8 Square Feet Lot
$-- Zestimate®
$51/sqft
$-- HOA
What's special
Full basementBrick bungalowCorner lot
- 313 days |
- 206 |
- 15 |
Zillow last checked: 7 hours ago
Listing updated: December 22, 2025 at 01:08am
Listed by:
Benjamin Ness 248-736-1175,
Clyde Realty LLC 313-974-1830,
Ian Breck 313-974-1830,
Clyde Realty LLC
Source: Realcomp II,MLS#: 20251004651
Facts & features
Interior
Bedrooms & bathrooms
- Bedrooms: 3
- Bathrooms: 1
- Full bathrooms: 1
Heating
- Forced Air, Natural Gas
Features
- Basement: Full,Unfinished
- Has fireplace: No
Interior area
- Total interior livable area: 971 sqft
- Finished area above ground: 971
Property
Parking
- Parking features: No Garage
Features
- Levels: Two
- Stories: 2
- Entry location: GroundLevelwSteps
- Pool features: None
Lot
- Size: 3,484.8 Square Feet
- Dimensions: 41.18 x 85.35
Details
- Parcel number: 21066829
- Special conditions: Short Sale No,Standard
Construction
Type & style
- Home type: SingleFamily
- Architectural style: Bungalow
- Property subtype: Single Family Residence
Materials
- Brick
- Foundation: Basement, Block
Condition
- New construction: No
- Year built: 1938
Utilities & green energy
- Sewer: Public Sewer, Sewer At Street
- Water: Public, Waterat Street
Community & HOA
Community
- Subdivision: RUEHLE HARPER AVE 1
HOA
- Has HOA: No
Location
- Region: Detroit
Financial & listing details
- Price per square foot: $51/sqft
- Tax assessed value: $19,900
- Annual tax amount: $2,123
- Date on market: 6/3/2025
- Cumulative days on market: 314 days
- Listing agreement: Exclusive Right To Sell
- Listing terms: Cash
- Exclusions: Exclusion(s) Do Not Exist
Estimated market value
Not available
Estimated sales range
Not available
$1,275/mo
Price history
Price history
| Date | Event | Price |
|---|---|---|
| 10/4/2025 | Price change | $50,000-9.1%$51/sqft |
Source: | ||
| 7/18/2025 | Price change | $55,000-8.3%$57/sqft |
Source: | ||
| 6/3/2025 | Listed for sale | $60,000+140%$62/sqft |
Source: | ||
| 4/8/2018 | Listing removed | $700$1/sqft |
Source: Go Section8 Report a problem | ||
| 3/16/2018 | Price change | $700-6.7%$1/sqft |
Source: Go Section8 Report a problem | ||
| 12/4/2017 | Price change | $750-6.3%$1/sqft |
Source: City Management Group Report a problem | ||
| 11/3/2017 | Price change | $800+1.9%$1/sqft |
Source: City Management Group Report a problem | ||
| 10/25/2017 | Price change | $785-1.9%$1/sqft |
Source: City Management Group Report a problem | ||
| 10/4/2017 | Listed for rent | $800$1/sqft |
Source: City Management Group Report a problem | ||
| 8/31/2017 | Sold | $25,000-3.5%$26/sqft |
Source: | ||
| 7/14/2017 | Pending sale | $25,900$27/sqft |
Source: City Management Group, Inc. #31325082 Report a problem | ||
| 7/12/2017 | Listed for sale | $25,900+283.7%$27/sqft |
Source: City Management Group, Inc. #31325082 Report a problem | ||
| 8/8/2010 | Listing removed | $6,750$7/sqft |
Source: RE/MAX ASSOCIATES #210069026 Report a problem | ||
| 6/11/2010 | Price change | $6,750-10%$7/sqft |
Source: foreclosure.com #210069026 Report a problem | ||
| 4/10/2010 | Listed for sale | $7,500-91.2%$8/sqft |
Source: foreclosure.com #210069026 Report a problem | ||
| 9/7/2006 | Sold | $85,000+129.7%$88/sqft |
Source: Public Record Report a problem | ||
| 7/13/2004 | Sold | $37,000$38/sqft |
Source: Public Record Report a problem | ||
Public tax history
Public tax history
| Year | Property taxes | Tax assessment |
|---|---|---|
| 2025 | -- | $19,900 +25.9% |
| 2024 | -- | $15,800 +19.7% |
| 2023 | -- | $13,200 +22.2% |
| 2022 | -- | $10,800 +4.9% |
| 2021 | -- | $10,300 |
| 2020 | $1,415 +53.3% | $10,300 +17% |
| 2019 | $923 | $8,800 +11.4% |
| 2018 | $923 | $7,900 +6.8% |
| 2017 | -- | $7,400 -38.3% |
| 2016 | $1,868 | $12,000 |
| 2015 | $1,868 +12.4% | $12,000 -27.8% |
| 2013 | $1,662 -11% | $16,621 -31.8% |
| 2010 | $1,868 | $24,369 -12% |
| 2009 | -- | $27,692 -13.5% |
| 2008 | -- | $32,014 |
| 2007 | -- | $32,014 +5.5% |
| 2005 | $371 | $30,345 +3% |
| 2004 | -- | $29,461 +104.2% |
| 2001 | $939 +12.2% | $14,429 +3.2% |
| 2000 | $837 | $13,981 |
Find assessor info on the county website
Climate risks
Neighborhood: Outer Drive-Hayes
Nearby schools
GreatSchools rating
- 3/10Wayne Elementary SchoolGrades: PK-5Distance: 0.4 mi
- 2/10Brown Ronald AcademyGrades: PK-8Distance: 0.5 mi
- 3/10Denby High SchoolGrades: 9-12Distance: 1.1 mi
Local experts in 48224


- Michigan
- Wayne County
- Detroit
- 48224
- Outer Drive-Hayes
- 9803 Nottingham Rd
Nearby cities
Nearby neighborhoods
Nearby zip codes
Other Detroit Topics
