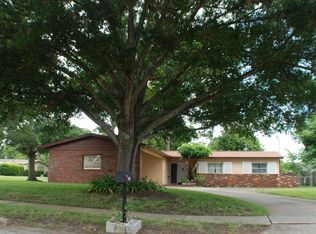
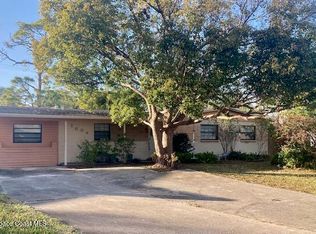
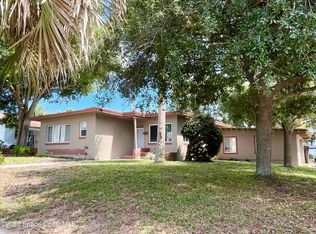
This 1173 square foot single family home has 3 bedrooms and 2.0 bathrooms. This home is located at 949 Lexington Rd, Rockledge, FL 32955.
Pre-foreclosure
Street View
Est. $249,500
949 Lexington Rd, Rockledge, FL 32955
3beds
2baths
1,173sqft
SingleFamily
Built in 1964
8,276 Square Feet Lot
$249,500 Zestimate®
$213/sqft
$-- HOA
Overview
- 45 days |
- 309 |
- 7 |
Facts & features
Interior
Bedrooms & bathrooms
- Bedrooms: 3
- Bathrooms: 2
Interior area
- Total interior livable area: 1,173 sqft
Property
Parking
- Parking features: Carport
Features
- Exterior features: Other, Stucco
Lot
- Size: 8,276 Square Feet
Details
- Parcel number: 253609IF56
Construction
Type & style
- Home type: SingleFamily
Materials
- masonry
- Roof: Asphalt
Condition
- Year built: 1964
Community & HOA
Location
- Region: Rockledge
Financial & listing details
- Price per square foot: $213/sqft
- Tax assessed value: $189,650
- Annual tax amount: $623
Visit our professional directory to find a foreclosure specialist in your area that can help with your home search.
Find a foreclosure agentForeclosure details
Estimated market value
$249,500
$222,000 - $272,000
$1,948/mo
Price history
Price history
| Date | Event | Price |
|---|---|---|
| 8/7/2009 | Sold | $87,500+43.4%$75/sqft |
Source: Public Record Report a problem | ||
| 4/26/2001 | Sold | $61,000$52/sqft |
Source: Public Record Report a problem | ||
Public tax history
Public tax history
| Year | Property taxes | Tax assessment |
|---|---|---|
| 2024 | $623 +0.8% | $74,950 +3% |
| 2023 | $619 +7.4% | $72,770 +3% |
| 2022 | $576 -2.4% | $70,660 +3% |
| 2021 | $590 -0.7% | $68,610 +1.4% |
| 2020 | $594 -0.7% | $67,670 +2.3% |
| 2019 | $598 | $66,150 +1.9% |
| 2018 | $598 -1.2% | $64,920 +2.1% |
| 2017 | $606 -1.7% | $63,590 +2.1% |
| 2016 | $616 -2% | $62,290 +0.7% |
| 2015 | $629 -2.7% | $61,860 +0.8% |
| 2014 | $646 | $61,370 -5.4% |
| 2013 | -- | $64,860 +9.1% |
| 2012 | $607 -0.9% | $59,460 -1.6% |
| 2011 | $612 -6.7% | $60,420 -16.6% |
| 2010 | $656 -57.6% | $72,430 -13.9% |
| 2009 | $1,547 -24.7% | $84,140 -24.3% |
| 2008 | $2,055 -8.4% | $111,100 -11.9% |
| 2007 | $2,244 +1.3% | $126,100 +26.5% |
| 2005 | $2,216 +34% | $99,710 +37.1% |
| 2004 | $1,653 +14% | $72,740 +6.1% |
| 2003 | $1,451 +6.3% | $68,530 +8.3% |
| 2002 | $1,364 +21.5% | $63,270 +14.1% |
| 2001 | $1,123 +1.9% | $55,440 +7.6% |
| 2000 | $1,102 | $51,520 |
Find assessor info on the county website
BuyAbility℠ payment
Estimated monthly payment
Boost your down payment with 6% savings match
Earn up to a 6% match & get a competitive APY with a *. Zillow has partnered with to help get you home faster.
Learn more*Terms apply. Match provided by Foyer. Account offered by Pacific West Bank, Member FDIC.Climate risks
Neighborhood: 32955
Nearby schools
GreatSchools rating
- 5/10Hans Christian Andersen Elementary SchoolGrades: PK-6Distance: 0.7 mi
- 6/10John F. Kennedy Middle SchoolGrades: 7-8Distance: 0.6 mi
- 4/10Rockledge Senior High SchoolGrades: 9-12Distance: 1.7 mi