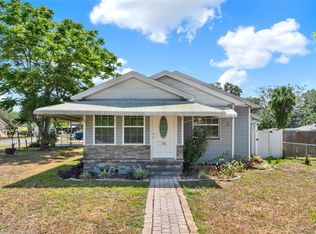
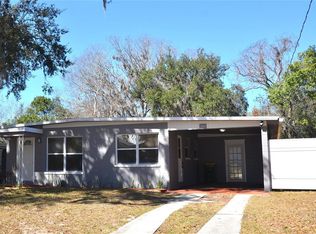
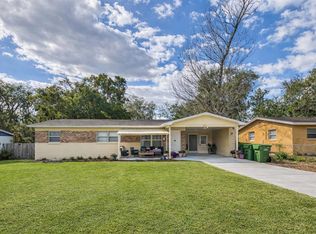
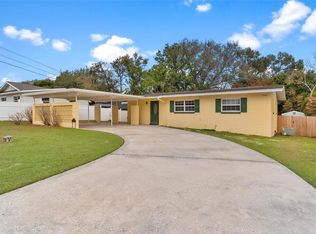
Updated 2/1 close to downtown Leesburg. Large fenced back yard. Large driveway in rear of house. Shed for all storage needs!
For sale by owner
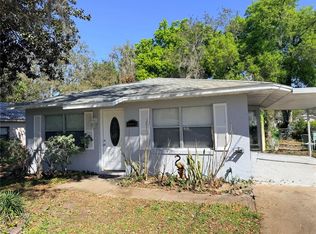
Street View
$240,000
906 Edmonds St, Leesburg, FL 34748
2beds
920sqft
Est.:
SingleFamily
Built in 1949
7,542 Square Feet Lot
$-- Zestimate®
$261/sqft
$-- HOA
Overview
- 24 days |
- 159 |
- 9 |
Listed by:
Property Owner (352) 602-0720
Facts & features
Interior
Bedrooms & bathrooms
- Bedrooms: 2
- Bathrooms: 1
- Full bathrooms: 1
Heating
- Forced air
Cooling
- Central
Appliances
- Included: Dryer, Microwave, Range / Oven, Refrigerator, Washer
Features
- Flooring: Tile, Linoleum / Vinyl
Interior area
- Total interior livable area: 920 sqft
Property
Parking
- Parking features: Off-street
Features
- Exterior features: Stucco, Cement / Concrete
Lot
- Size: 7,542 Square Feet
Details
- Parcel number: 231924120000001900
Construction
Type & style
- Home type: SingleFamily
Materials
- wood frame
- Foundation: Slab
- Roof: Metal
Condition
- New construction: No
- Year built: 1949
Community & HOA
Location
- Region: Leesburg
Financial & listing details
- Price per square foot: $261/sqft
- Tax assessed value: $82,599
- Annual tax amount: $835
- Date on market: 3/7/2026
Estimated market value
Not available
Estimated sales range
Not available
$1,370/mo
Price history
Price history
| Date | Event | Price |
|---|---|---|
| 3/7/2026 | Listed for sale | $240,000-4%$261/sqft |
Source: Owner Report a problem | ||
| 5/20/2025 | Listing removed | -- |
Source: Owner Report a problem | ||
| 3/31/2025 | Listed for sale | $250,000+76.1%$272/sqft |
Source: Owner Report a problem | ||
| 1/4/2023 | Sold | $142,000+102.9%$154/sqft |
Source: Public Record Report a problem | ||
| 8/11/2021 | Sold | $70,000+40%$76/sqft |
Source: Public Record Report a problem | ||
| 4/2/2016 | Listing removed | $800$1/sqft |
Source: MORRIS REALTY AND INVESTMENTS #G4824824 Report a problem | ||
| 3/15/2016 | Listed for rent | $800$1/sqft |
Source: MORRIS REALTY AND INVESTMENTS #G4824824 Report a problem | ||
| 12/30/2011 | Sold | $50,000+42.9%$54/sqft |
Source: Public Record Report a problem | ||
| 6/25/2009 | Sold | $35,000-12.5%$38/sqft |
Source: Public Record Report a problem | ||
| 4/12/2009 | Price change | $40,000-11.1%$43/sqft |
Source: foreclosure.com Report a problem | ||
| 3/15/2009 | Price change | $45,000-10%$49/sqft |
Source: foreclosure.com Report a problem | ||
| 2/2/2009 | Listed for sale | $50,000+11.1%$54/sqft |
Source: foreclosure.com Report a problem | ||
| 2/24/1998 | Sold | $45,000$49/sqft |
Source: Public Record Report a problem | ||
Public tax history
Public tax history
| Year | Property taxes | Tax assessment |
|---|---|---|
| 2025 | $835 -7.6% | $82,599 -4.5% |
| 2024 | $904 -36% | $86,451 +16.3% |
| 2023 | $1,412 +15.1% | $74,340 +10% |
| 2022 | $1,227 +34.9% | $67,589 +44.5% |
| 2021 | $910 +3.9% | $46,767 +10% |
| 2020 | $875 +14.1% | $42,515 +10% |
| 2019 | $767 +1.4% | $38,650 |
| 2018 | $756 | $38,650 +8.5% |
| 2017 | $756 +7.4% | $35,634 +12.1% |
| 2016 | $704 +284.8% | $31,786 +0.7% |
| 2015 | $183 +51.3% | $31,566 +0.8% |
| 2014 | $121 +12.4% | $31,316 +1.5% |
| 2013 | $108 -2.8% | $30,854 -0.4% |
| 2012 | $111 -83.3% | $30,972 -13.4% |
| 2011 | $662 -26.8% | $35,774 -25.9% |
| 2010 | $904 -20% | $48,302 -20.1% |
| 2009 | $1,131 +165.6% | $60,442 +26.5% |
| 2008 | $426 +4.9% | $47,772 +3% |
| 2007 | $406 -1.5% | $46,381 +2.5% |
| 2006 | $412 +5.6% | $45,250 +3% |
| 2005 | $390 +6.9% | $43,933 +3% |
| 2004 | $365 +1.9% | $42,654 +1.3% |
| 2003 | $358 +6% | $42,091 +3% |
| 2002 | $338 +4.3% | $40,878 -0.2% |
| 2001 | $324 -62% | $40,957 |
| 2000 | $853 | $40,957 |
Find assessor info on the county website
BuyAbility℠ payment
Est. payment
$1,525/mo
Principal & interest
$1209
Property taxes
$316
More affordability tools
Climate risks
Neighborhood: 34748
Nearby schools
GreatSchools rating
- 1/10Leesburg Elementary SchoolGrades: PK-5Distance: 1.6 mi
- 3/10Carver Middle SchoolGrades: 6-8Distance: 1.1 mi
- 2/10Leesburg High SchoolGrades: 9-12Distance: 1 mi
Local experts in 34748

- Florida
- Lake County
- Leesburg
- 34748
- 906 Edmonds St
Nearby cities
Nearby neighborhoods
Nearby zip codes
Other Leesburg Topics
