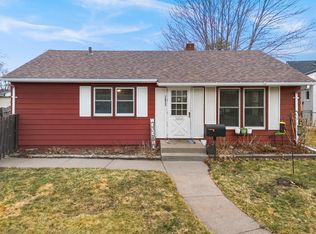
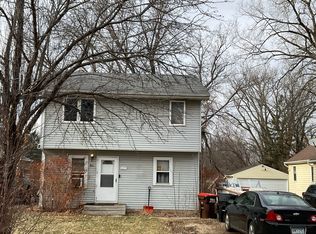
This 1292 square foot single family home has 3 bedrooms and 1.0 bathrooms. This home is located at 885 Howard St N, Saint Paul, MN 55119.
Pre-foreclosure
Est. $260,600
885 Howard St N, Saint Paul, MN 55119
3beds
1,292sqft
SingleFamily
Built in 1953
6,534 Square Feet Lot
$260,600 Zestimate®
$202/sqft
$-- HOA
Overview
- 41 days |
- 13 |
- 1 |
Facts & features
Interior
Bedrooms & bathrooms
- Bedrooms: 3
- Bathrooms: 1
- Full bathrooms: 1
Heating
- Other
Cooling
- Central
Features
- Basement: Finished
Interior area
- Total interior livable area: 1,292 sqft
Property
Parking
- Parking features: Garage - Detached
Features
- Exterior features: Other
Lot
- Size: 6,534 Square Feet
Details
- Parcel number: 262922410064
Construction
Type & style
- Home type: SingleFamily
Materials
- Roof: Asphalt
Condition
- Year built: 1953
Community & HOA
Location
- Region: Saint Paul
Financial & listing details
- Price per square foot: $202/sqft
- Tax assessed value: $239,600
- Annual tax amount: $4,276
Visit our professional directory to find a foreclosure specialist in your area that can help with your home search.
Find a foreclosure agentForeclosure details
Estimated market value
$260,600
$248,000 - $274,000
$1,915/mo
Price history
Price history
| Date | Event | Price |
|---|---|---|
| 5/28/2021 | Sold | $245,000+11.4%$190/sqft |
Source: | ||
| 4/24/2021 | Pending sale | $219,900$170/sqft |
Source: | ||
| 4/17/2021 | Listed for sale | $219,900+47.1%$170/sqft |
Source: | ||
| 11/9/2016 | Sold | $149,500+3.1%$116/sqft |
Source: | ||
| 9/24/2016 | Listed for sale | $145,000+51.7%$112/sqft |
Source: Coldwell Banker Burnet - Minneapolis Lakes #4764463 Report a problem | ||
| 8/10/2016 | Listing removed | -- |
Source: Auction.com Report a problem | ||
| 7/12/2016 | Price change | -- |
Source: Auction.com Report a problem | ||
| 4/14/2016 | Price change | $95,612-36.2%$74/sqft |
Source: Auction.com Report a problem | ||
| 4/7/2016 | Listed for sale | -- |
Source: Auction.com Report a problem | ||
| 9/14/2015 | Listing removed | $149,900$116/sqft |
Source: Keller Williams - Woodbury - East Suburban #4622638 Report a problem | ||
| 7/29/2015 | Price change | $149,900-2%$116/sqft |
Source: Keller Williams - Woodbury - East Suburban #4622638 Report a problem | ||
| 6/11/2015 | Price change | $152,900-1.3%$118/sqft |
Source: Keller Williams - Woodbury - East Suburban #4622638 Report a problem | ||
| 5/14/2015 | Price change | $154,900-1.9%$120/sqft |
Source: Keller Williams - Woodbury - East Suburban #4583020 Report a problem | ||
| 4/30/2015 | Price change | $157,900-1.3%$122/sqft |
Source: Keller Williams - Woodbury - East Suburban #4583020 Report a problem | ||
| 4/11/2015 | Listed for sale | $159,900$124/sqft |
Source: Keller Williams - Woodbury - East Suburban #4583020 Report a problem | ||
Public tax history
Public tax history
| Year | Property taxes | Tax assessment |
|---|---|---|
| 2025 | $4,276 +19.4% | $239,600 +3.7% |
| 2024 | $3,582 +0.7% | $231,100 +2.7% |
| 2023 | $3,556 +25% | $225,100 -4.5% |
| 2022 | $2,844 +11.5% | $235,800 +30.7% |
| 2021 | $2,550 +5.2% | $180,400 +3.4% |
| 2020 | $2,424 +13.2% | $174,500 +14.8% |
| 2019 | $2,141 | $152,000 |
| 2018 | $2,141 -3.7% | $152,000 +0.1% |
| 2017 | $2,224 | $151,900 |
| 2016 | $2,224 +8.1% | -- |
| 2015 | $2,058 +49.8% | $124,000 |
| 2014 | $1,374 +3.5% | -- |
| 2013 | $1,328 -7.1% | -- |
| 2012 | $1,430 -0.6% | -- |
| 2011 | $1,438 | -- |
| 2010 | -- | -- |
| 2009 | $1,796 +6.3% | -- |
| 2008 | $1,690 +7.1% | -- |
| 2007 | $1,578 +2.3% | -- |
| 2006 | $1,542 +32.7% | -- |
| 2005 | $1,162 -4.3% | -- |
| 2004 | $1,214 +10.4% | -- |
| 2003 | $1,100 +14.8% | -- |
| 2002 | $958 -10.5% | -- |
| 2001 | $1,070 +32.6% | -- |
| 2000 | $807 | -- |
Find assessor info on the county website
BuyAbility℠ payment
Estimated monthly payment
All calculations are estimates and provided by Zillow, Inc. for informational purposes only. Actual amounts may vary.
HOA fees may include property taxes on listings classified as Co-Ops. Contact the listing agent and/or owner for fee details.
Mortgage interest rates are dependent on a number of factors, including credit score, down payment, and repayment length. Interest rate data provided by Zillow Group Marketplace, Inc. as of 1/1/1970 from various mortgage lenders with which we have lead or other similar arrangements; the Estimated Payment is an average of those rates.
See how much you could borrow to make a competitive offer.
Boost your down payment with 6% savings match
Earn up to a 6% match & get a competitive APY with a *. Zillow has partnered with to help get you home faster.
Learn more*Terms apply. Match provided by Foyer. Account offered by Pacific West Bank, Member FDIC.Climate risks
Neighborhood: Greater Eastside
Nearby schools
GreatSchools rating
- 1/10Hazel Park Preparatory AcademyGrades: PK-8Distance: 0.9 mi
- 2/10Johnson Senior High SchoolGrades: 9-12Distance: 3 mi
- 2/10Battle Creek Middle SchoolGrades: 6-8Distance: 1.6 mi

- Minnesota
- Ramsey County
- Saint Paul
- 55119
- Greater Eastside
- 885 Howard St N
Nearby cities
Nearby neighborhoods
Nearby zip codes
Other Saint Paul Topics
