$325,000
3 bd|4 ba|2.5k sqft
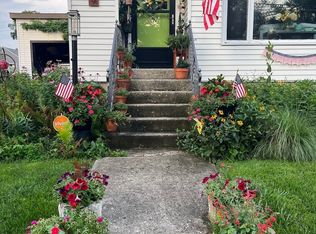
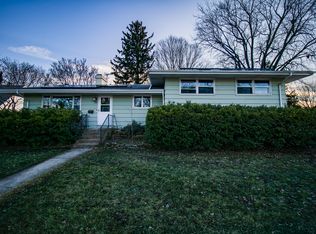
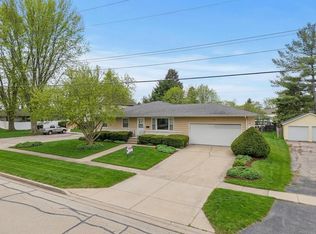
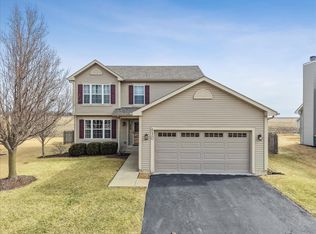
830 Spring Meadow Ln, Malta, IL 60150
For Sale
Likely to sell faster than
Zillow last checked: 7 hours ago
Listing updated: February 15, 2026 at 12:27am
Justin Hibshman 815-761-3664,
Coldwell Banker Real Estate Group
Not available
Estimated sales range
Not available
Not available
| Date | Event | Price |
|---|---|---|
| 2/14/2026 | Pending sale | $280,000$161/sqft |
Source: | ||
| 12/1/2025 | Listed for sale | $280,000+112.1%$161/sqft |
Source: | ||
| 1/29/2016 | Sold | $132,000-5.7%$76/sqft |
Source: | ||
| 12/19/2015 | Pending sale | $140,000$80/sqft |
Source: Baird & Warner #09092995 Report a problem | ||
| 11/27/2015 | Listed for sale | $140,000+17.6%$80/sqft |
Source: Baird & Warner #09092995 Report a problem | ||
| 8/7/2013 | Sold | $119,000-4.4%$68/sqft |
Source: | ||
| 4/24/2013 | Listed for sale | $124,500+43.9%$71/sqft |
Source: Visual Tour #08323848 Report a problem | ||
| 3/5/2013 | Sold | $86,500-20.3%$50/sqft |
Source: Public Record Report a problem | ||
| 1/12/2013 | Price change | $108,500-8%$62/sqft |
Source: Hubzu #08216332 Report a problem | ||
| 12/16/2012 | Price change | $117,900-7.2%$68/sqft |
Source: Hubzu #08216332 Report a problem | ||
| 11/9/2012 | Listed for sale | $127,000-5.9%$73/sqft |
Source: Hubzu #08216332 Report a problem | ||
| 5/25/2012 | Listing removed | $135,000$77/sqft |
Source: Spirit Realty DBA Signature Real Estate Professionals #07683217 Report a problem | ||
| 12/17/2011 | Price change | $135,000-9.9%$77/sqft |
Source: Spirit Realty DBA Signature Real Estate Professionals #07683217 Report a problem | ||
| 12/3/2010 | Listed for sale | $149,900-24.1%$86/sqft |
Source: TheListingWidget.com #07683217 Report a problem | ||
| 11/20/2006 | Sold | $197,500$113/sqft |
Source: Public Record Report a problem | ||
| Year | Property taxes | Tax assessment |
|---|---|---|
| 2024 | $5,249 +0.5% | $72,312 +13.6% |
| 2023 | $5,222 +1.9% | $63,655 +10% |
| 2022 | $5,123 -2.9% | $57,868 +5.1% |
| 2021 | $5,275 +1.8% | $55,039 +4.5% |
| 2020 | $5,184 +2.6% | $52,659 +3.9% |
| 2019 | $5,050 -1.9% | $50,682 +0.7% |
| 2018 | $5,147 +3.5% | $50,320 +6.4% |
| 2017 | $4,972 +1.4% | $47,293 +2.5% |
| 2016 | $4,903 | $46,158 +6% |
| 2015 | -- | $43,545 +0.9% |
| 2014 | -- | $43,165 -2.8% |
| 2013 | -- | $44,423 -7.9% |
| 2012 | -- | $48,249 -11.1% |
| 2011 | -- | $54,298 -6.4% |
| 2010 | -- | $57,980 -7.3% |
| 2009 | -- | $62,545 -15.2% |
| 2008 | -- | $73,777 +5% |
| 2007 | -- | $70,284 +10.9% |
| 2006 | -- | $63,349 |
Find assessor info on the county website
Source: MRED as distributed by MLS GRID. This data may not be complete. We recommend contacting the local school district to confirm school assignments for this home.