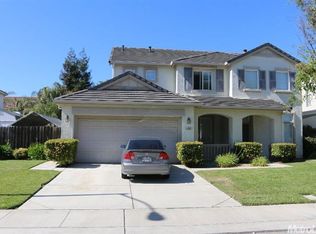
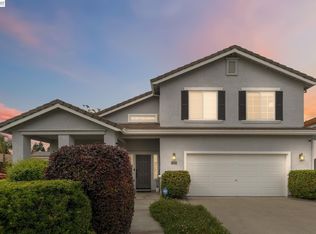
This 2759 square foot single family home has 5 bedrooms and 3.0 bathrooms. This home is located at 791 Randall Way, Manteca, CA 95337.
Pre-foreclosure
Est. $730,400
791 Randall Way, Manteca, CA 95337
5beds
2,759sqft
1 House on Lot
Built in 2000
7,265 Square Feet Lot
$730,400 Zestimate®
$265/sqft
$-- HOA
Overview
- 179 days |
- 31 |
- 0 |
Facts & features
Interior
Bedrooms & bathrooms
- Bedrooms: 5
- Bathrooms: 3
- Full bathrooms: 3
Heating
- Forced air, Electric, Gas
Cooling
- Central
Appliances
- Included: Dishwasher, Microwave
- Laundry: Upper Level, Inside Area
Features
- Ceiling Fan(s)
- Flooring: Tile, Carpet, Laminate
- Has fireplace: Yes
- Fireplace features: Dining Room
Interior area
- Total interior livable area: 2,759 sqft
Property
Parking
- Total spaces: 2
- Parking features: Garage - Attached
Features
- Exterior features: Stucco, Wood
- Pool features: Gunite, Private, Pool/Spa Combo, Built-In
- Has spa: Yes
Lot
- Size: 7,265 Square Feet
- Features: Few Trees, Sidewalk/Curb/Gutter
Details
- Parcel number: 224180450000
- Zoning: RES
Construction
Type & style
- Home type: SingleFamily
- Property subtype: 1 House on Lot
Materials
- wood frame
- Roof: Tile
Condition
- Year built: 2000
Utilities & green energy
- Electric: 220 Volts, 220 Volts in Laundry, 220 Volts in Kitchen
- Sewer: Public Sewer
- Water: Public District
- Utilities for property: Natural Gas Connected
Green energy
- Energy efficient items: Solar Heating
Community & HOA
Location
- Region: Manteca
Financial & listing details
- Price per square foot: $265/sqft
- Tax assessed value: $582,362
- Annual tax amount: $7,291
- Road surface type: Paved
Visit our professional directory to find a foreclosure specialist in your area that can help with your home search.
Find a foreclosure agentForeclosure details
Estimated market value
$730,400
$694,000 - $767,000
$3,387/mo
Price history
Price history
| Date | Event | Price |
|---|---|---|
| 6/10/2020 | Sold | $532,500+0.5%$193/sqft |
Source: MetroList Services of CA #20017076 Report a problem | ||
| 5/5/2020 | Pending sale | $530,000$192/sqft |
Source: Home Buyers Realty #20017076 Report a problem | ||
| 4/24/2020 | Listed for sale | $530,000$192/sqft |
Source: Home Buyers Realty #20017076 Report a problem | ||
| 3/20/2020 | Pending sale | $530,000$192/sqft |
Source: Home Buyers Realty #20017076 Report a problem | ||
| 3/18/2020 | Listed for sale | $530,000+1.5%$192/sqft |
Source: Home Buyers Realty #20017076 Report a problem | ||
| 3/28/2018 | Sold | $522,000$189/sqft |
Source: MetroList Services of CA #18012508 Report a problem | ||
| 3/21/2018 | Pending sale | $522,000$189/sqft |
Source: Union Strong Homeowners, Inc. #18012508 Report a problem | ||
| 3/5/2018 | Price change | $522,000+0.4%$189/sqft |
Source: Union Strong Homeowners, Inc. #18012508 Report a problem | ||
| 3/4/2018 | Pending sale | $520,000$188/sqft |
Source: Union Strong Homeowners, Inc. #18012508 Report a problem | ||
| 3/2/2018 | Listed for sale | $520,000+122.7%$188/sqft |
Source: Union Strong Homeowners, Inc. #18012508 Report a problem | ||
| 7/21/2000 | Sold | $233,500$85/sqft |
Source: Public Record Report a problem | ||
Public tax history
Public tax history
| Year | Property taxes | Tax assessment |
|---|---|---|
| 2025 | $7,291 +2.6% | $582,362 +2% |
| 2024 | $7,109 +1.1% | $570,944 +2% |
| 2023 | $7,033 +1.4% | $559,750 +2% |
| 2022 | $6,935 +1% | $548,775 +2% |
| 2021 | $6,868 +3.1% | $538,016 -0.9% |
| 2020 | $6,659 +1.2% | $543,088 +2% |
| 2019 | $6,580 +46.2% | $532,440 +56% |
| 2018 | $4,501 +1.1% | $341,248 +2% |
| 2017 | $4,453 +1.8% | $334,557 +2% |
| 2016 | $4,373 +6% | $328,000 +1.5% |
| 2015 | $4,125 | $323,076 +2% |
| 2014 | $4,125 | $316,748 +3.5% |
| 2013 | -- | $306,000 +24.9% |
| 2012 | -- | $245,000 -5.8% |
| 2011 | -- | $260,000 -5.5% |
| 2010 | -- | $275,000 +5.8% |
| 2009 | -- | $260,000 -12% |
| 2008 | -- | $295,617 +2% |
| 2007 | -- | $289,822 +2% |
| 2006 | -- | $284,140 +2% |
| 2005 | -- | $278,570 +2% |
| 2004 | -- | $273,108 +1.9% |
| 2003 | -- | $268,104 +3.8% |
| 2002 | -- | $258,183 +10.7% |
| 2001 | -- | $233,183 |
Find assessor info on the county website
Monthly payment
Estimated monthly payment
All calculations are estimates and provided by Zillow, Inc. for informational purposes only. Actual amounts may vary.
HOA fees may include property taxes on listings classified as Co-Ops. Contact the listing agent and/or owner for fee details.
Mortgage interest rates are dependent on a number of factors, including credit score, down payment, and repayment length. Interest rate data provided by Zillow Group Marketplace, Inc. as of 1/1/1970 from various mortgage lenders with which we have lead or other similar arrangements; the Estimated Payment is an average of those rates.
See how much you could borrow to make a competitive offer.
Climate risks
Neighborhood: 95337
Nearby schools
GreatSchools rating
- 5/10Walter Woodward Elementary SchoolGrades: K-8Distance: 0.2 mi
- 5/10Manteca High SchoolGrades: 9-12Distance: 1.9 mi
- California
- San Joaquin County
- Manteca
- 95337
- 791 Randall Way
Nearby cities
Nearby zip codes
Other Manteca Topics
