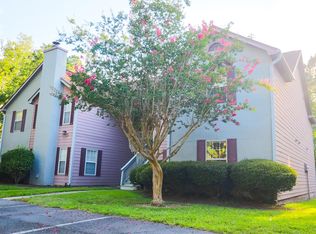
$292,300
3 bd|2 ba|1.4k sqft
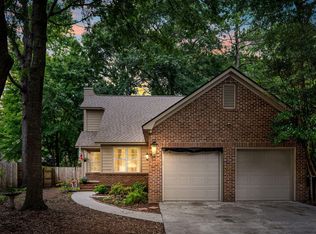
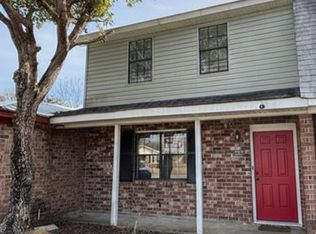
7824 Racquet Rd, North Charleston, SC 29418
Off Market
Likely to sell faster than
Zillow last checked: 8 hours ago
Listing updated: January 27, 2026 at 09:17am
Sloane Realty
$291,000
$276,000 - $306,000
$1,959/mo
| Date | Event | Price |
|---|---|---|
| 1/16/2026 | Listed for sale | $295,500-9.1%$226/sqft |
Source: | ||
| 12/6/2025 | Listing removed | $325,000$248/sqft |
Source: | ||
| 8/5/2025 | Listed for sale | $325,000+168.6%$248/sqft |
Source: | ||
| 12/4/2018 | Listing removed | $1,400$1/sqft |
Source: Sloane Realty Report a problem | ||
| 9/17/2018 | Listed for rent | $1,400+1.8%$1/sqft |
Source: Sloane Realty - Property Management & Sales Report a problem | ||
| 10/6/2017 | Listing removed | $1,375$1/sqft |
Source: Zillow Rental Network Report a problem | ||
| 9/5/2017 | Listed for rent | $1,375$1/sqft |
Source: Zillow Rental Network Report a problem | ||
| 1/24/2017 | Listing removed | $1,375+7.8%$1/sqft |
Source: Zillow Rental Network Report a problem | ||
| 2/10/2016 | Listing removed | $1,275$1/sqft |
Source: Sloane Realty #15030630 Report a problem | ||
| 1/9/2016 | Price change | $1,275-1.9%$1/sqft |
Source: Zillow Rental Network Report a problem | ||
| 12/29/2015 | Price change | $1,300-3.7%$1/sqft |
Source: Zillow Rental Network Report a problem | ||
| 12/10/2015 | Listed for rent | $1,350$1/sqft |
Source: Zillow Rental Network Report a problem | ||
| 4/21/2014 | Sold | $121,000-3.2%$93/sqft |
Source: Public Record Report a problem | ||
| 3/20/2012 | Sold | $125,000+14.7%$96/sqft |
Source: Public Record Report a problem | ||
| 8/3/2006 | Sold | $109,000$83/sqft |
Source: Public Record Report a problem | ||
| Year | Property taxes | Tax assessment |
|---|---|---|
| 2024 | $2,429 +2.5% | $7,590 |
| 2023 | $2,370 +4.4% | $7,590 |
| 2022 | $2,270 +0.8% | $7,590 |
| 2021 | $2,253 +0.8% | $7,590 |
| 2020 | $2,234 | $7,590 +15% |
| 2019 | $2,234 | $6,600 |
| 2017 | $2,234 +16.5% | $6,600 |
| 2016 | $1,918 +3% | $6,600 |
| 2015 | $1,863 +3.3% | $6,600 |
| 2014 | $1,803 | -- |
| 2011 | $1,803 -13.7% | -- |
| 2010 | $2,090 -0.9% | $7,940 |
| 2009 | $2,108 +4.7% | $7,940 |
| 2008 | $2,014 +130% | $7,940 +50.1% |
| 2006 | $876 -2.1% | $5,290 |
| 2005 | $894 +57.1% | $5,290 +72.3% |
| 2004 | $569 +2.6% | $3,070 |
| 2003 | $555 +5.9% | $3,070 |
| 2002 | $524 -1.4% | $3,070 -3.5% |
| 2000 | $531 | $3,180 |
Find assessor info on the county website
Source: CTMLS. This data may not be complete. We recommend contacting the local school district to confirm school assignments for this home.