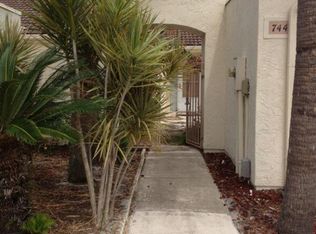
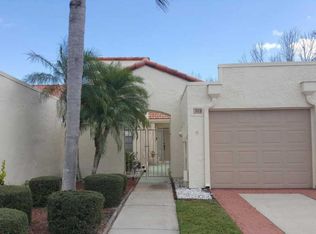
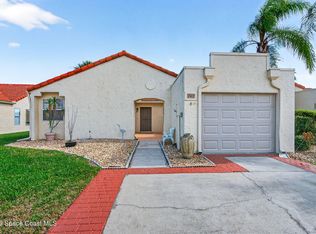
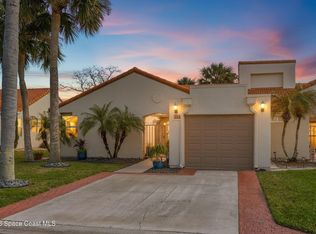
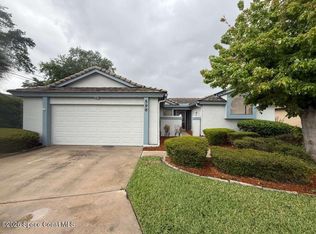
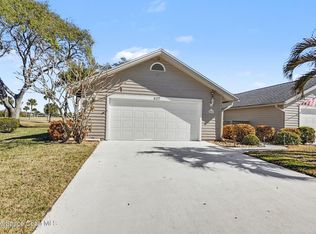
The Community is located on the Suntree Golf Course! End Unit ''Lots of Sunshine!'' with Large courtyard entrance, Bright, spacious open concept floor plan with 3 bedrooms, 2 baths, open dining and living room area, eat-in kitchen, Large master bedroom and master bath with double vanities, shower and walk-in closet. Nice screened patio. Well maintained - Close to everything.Exterior was recently painted and the roofs where just replaced in the past year. Home has original fixtures that are in excellent condition.well maintained home is currently tenant occupied until end of July, tenant willing to remain or move.
Pre-foreclosure
Est. $309,900
746 Spring Valley Dr, Melbourne, FL 32940
3beds
1,845sqft
Townhouse
Built in 1985
2,613 Square Feet Lot
$309,900 Zestimate®
$168/sqft
$350/mo HOA
Overview
- 100 days |
- 23 |
- 0 |
Facts & features
Interior
Bedrooms & bathrooms
- Bedrooms: 3
- Bathrooms: 2
- Full bathrooms: 2
Heating
- Electric
Cooling
- Central
Appliances
- Included: Dishwasher, Microwave, Range / Oven
Features
- Flooring: Carpet, Linoleum / Vinyl
Interior area
- Total interior livable area: 1,845 sqft
Property
Parking
- Parking features: Garage - Attached
Features
- Exterior features: Stucco
Lot
- Size: 2,613 Square Feet
Details
- Parcel number: 263613ND27
Construction
Type & style
- Home type: Townhouse
Materials
- Frame
- Roof: Tile
Condition
- Year built: 1985
Community & HOA
HOA
- Has HOA: Yes
- HOA fee: $350 monthly
Location
- Region: Melbourne
Financial & listing details
- Price per square foot: $168/sqft
- Tax assessed value: $264,720
- Annual tax amount: $3,549
Visit our professional directory to find a foreclosure specialist in your area that can help with your home search.
Find a foreclosure agentForeclosure details
Estimated market value
$309,900
$291,000 - $328,000
$2,366/mo
Price history
Price history
| Date | Event | Price |
|---|---|---|
| 8/16/2016 | Sold | $170,000+2.5%$92/sqft |
Source: Space Coast AOR #751261 Report a problem | ||
| 8/1/2016 | Pending sale | $165,900$90/sqft |
Source: RE/MAX 2000 #751261 Report a problem | ||
| 7/29/2016 | Listed for sale | $165,900$90/sqft |
Source: RE/MAX 2000 #751261 Report a problem | ||
| 7/14/2016 | Pending sale | $165,900$90/sqft |
Source: RE/MAX 2000 #751261 Report a problem | ||
| 7/7/2016 | Listed for sale | $165,900$90/sqft |
Source: RE/MAX 2000 #751261 Report a problem | ||
| 4/16/2016 | Pending sale | $165,900$90/sqft |
Source: RE/MAX 2000 #751261 Report a problem | ||
| 4/8/2016 | Listed for sale | $165,900+25.7%$90/sqft |
Source: RE/MAX 2000 #751261 Report a problem | ||
| 7/10/2014 | Listing removed | $1,225$1/sqft |
Source: RE/MAX 2000 #698281 Report a problem | ||
| 7/1/2014 | Price change | $1,225-2%$1/sqft |
Source: RE/MAX 2000 #698281 Report a problem | ||
| 6/3/2014 | Listed for rent | $1,250$1/sqft |
Source: RE/MAX 2000 #698281 Report a problem | ||
| 7/7/2009 | Sold | $132,000-38.6%$72/sqft |
Source: Public Record Report a problem | ||
| 8/11/2006 | Sold | $215,000+30.7%$117/sqft |
Source: Public Record Report a problem | ||
| 7/8/2004 | Sold | $164,500$89/sqft |
Source: Public Record Report a problem | ||
Public tax history
Public tax history
| Year | Property taxes | Tax assessment |
|---|---|---|
| 2024 | $3,549 +10.3% | $264,720 +17.6% |
| 2023 | $3,216 +12.4% | $225,110 +9.1% |
| 2022 | $2,861 +4.1% | $206,350 +19% |
| 2021 | $2,749 +8.5% | $173,380 +10.6% |
| 2020 | $2,534 -1.2% | $156,780 -0.9% |
| 2019 | $2,564 | $158,260 +2.8% |
| 2018 | $2,564 +0.2% | $153,890 +6.5% |
| 2017 | $2,559 +2.1% | $144,530 +21.1% |
| 2016 | $2,506 +13% | $119,360 +8.4% |
| 2015 | $2,217 +7.8% | $110,110 +10% |
| 2014 | $2,057 | $100,100 +5.1% |
| 2013 | -- | $95,220 +15.1% |
| 2012 | $1,456 +3.2% | $82,730 +3.3% |
| 2011 | $1,411 -9.1% | $80,080 -16.5% |
| 2010 | $1,553 -0.8% | $95,880 -31.5% |
| 2008 | $1,566 -18.5% | $140,000 -7.9% |
| 2007 | $1,922 -28.7% | $152,000 +11.2% |
| 2005 | $2,695 +32.9% | $136,630 +33.7% |
| 2004 | $2,028 +98.8% | $102,160 +11.2% |
| 2003 | $1,020 +3.6% | $91,880 +11.6% |
| 2002 | $985 +3.1% | $82,340 +8.7% |
| 2001 | $955 +8.5% | $75,740 +6.6% |
| 2000 | $881 | $71,060 |
Find assessor info on the county website
Monthly payment
Estimated monthly payment
All calculations are estimates and provided by Zillow, Inc. for informational purposes only. Actual amounts may vary.
HOA fees may include property taxes on listings classified as Co-Ops. Contact the listing agent and/or owner for fee details.
Mortgage interest rates are dependent on a number of factors, including credit score, down payment, and repayment length. Interest rate data provided by Zillow Group Marketplace, Inc. as of 1/1/1970 from various mortgage lenders with which we have lead or other similar arrangements; the Estimated Payment is an average of those rates.
See how much you could borrow to make a competitive offer.
Climate risks
Neighborhood: 32940
Nearby schools
GreatSchools rating
- 9/10Suntree Elementary SchoolGrades: PK-6Distance: 0.4 mi
- 7/10Delaura Middle SchoolGrades: 7-8Distance: 5.7 mi
- 7/10Viera High SchoolGrades: PK,9-12Distance: 4.1 mi
- Florida
- Brevard County
- Melbourne
- 32940
- 746 Spring Valley Dr
Nearby cities
Nearby neighborhoods
Nearby zip codes
Other Melbourne Topics
