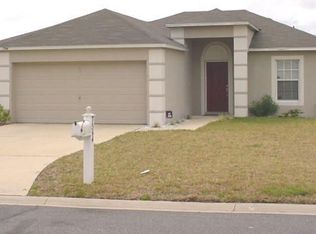
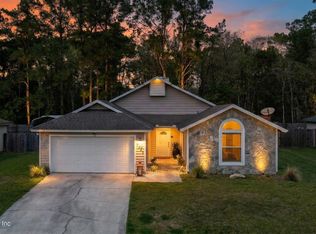
Beautifully updated home ready for you to move right in! Amazing kitchen with stainless steel appliances, granite counter tops and glass tile backsplash! Tile and laminate wood floors in the living areas and carpet in the bedroom. This house is a must see!
Pre-foreclosure
Est. $286,900
7352 Governors Park Rd, Jacksonville, FL 32244
4beds
2baths
1,874sqft
SingleFamily
Built in 2003
6,098 Square Feet Lot
$286,900 Zestimate®
$153/sqft
$20/mo HOA
Overview
- 177 days |
- 7 |
- 0 |
Facts & features
Interior
Bedrooms & bathrooms
- Bedrooms: 4
- Bathrooms: 2
Heating
- None, Forced air
Cooling
- Central
Features
- Flooring: Other
- Has fireplace: Yes
Interior area
- Total interior livable area: 1,874 sqft
Property
Parking
- Total spaces: 2
- Parking features: Garage - Attached
Features
- Exterior features: Other
Lot
- Size: 6,098 Square Feet
Details
- Parcel number: 0160578995
Construction
Type & style
- Home type: SingleFamily
Materials
- Roof: Other
Condition
- Year built: 2003
Community & HOA
HOA
- Has HOA: Yes
- HOA fee: $20 monthly
Location
- Region: Jacksonville
Financial & listing details
- Price per square foot: $153/sqft
- Tax assessed value: $242,960
- Annual tax amount: $1,815
Visit our professional directory to find a foreclosure specialist in your area that can help with your home search.
Find a foreclosure agentForeclosure details
Estimated market value
$286,900
$273,000 - $301,000
$1,832/mo
Price history
Price history
| Date | Event | Price |
|---|---|---|
| 10/19/2015 | Sold | $137,500-8.3%$73/sqft |
Source: | ||
| 8/25/2015 | Pending sale | $149,900$80/sqft |
Source: KELLER WILLIAMS REALTY ATLANTIC PARTNERS SOUTHSIDE #782879 Report a problem | ||
| 8/14/2015 | Price change | $149,900-3.2%$80/sqft |
Source: Keller Williams - Jacksonville Southside #782879 Report a problem | ||
| 8/4/2015 | Price change | $154,900-2.6%$83/sqft |
Source: Keller Williams - Jacksonville Southside #782879 Report a problem | ||
| 7/14/2015 | Listed for sale | $159,000+84.7%$85/sqft |
Source: Owner Report a problem | ||
| 2/25/2015 | Sold | $86,100-14.9%$46/sqft |
Source: | ||
| 2/23/2015 | Pending sale | $101,200$54/sqft |
Source: I ON REAL ESTATE & INVESTMENTS #750372 Report a problem | ||
| 1/29/2015 | Price change | $101,200+106.5%$54/sqft |
Source: I ON REAL ESTATE & INVESTMENTS #750372 Report a problem | ||
| 1/13/2015 | Price change | $49,000-51.6%$26/sqft |
Source: HomeSearch.com Realty Services Inc Report a problem | ||
| 12/23/2014 | Listed for sale | $101,200-6.5%$54/sqft |
Source: I ON REAL ESTATE & INVESTMENTS #750372 Report a problem | ||
| 10/16/2014 | Sold | $108,200-0.9%$58/sqft |
Source: Public Record Report a problem | ||
| 7/10/2014 | Sold | $109,200-9.5%$58/sqft |
Source: Public Record Report a problem | ||
| 6/21/2014 | Listed for sale | -- |
Source: Auction.com Report a problem | ||
| 8/6/2003 | Sold | $120,600-33.7%$64/sqft |
Source: Public Record Report a problem | ||
| 11/4/2002 | Sold | $182,000$97/sqft |
Source: Public Record Report a problem | ||
Public tax history
Public tax history
| Year | Property taxes | Tax assessment |
|---|---|---|
| 2024 | $1,815 +3.5% | $136,848 +3% |
| 2023 | $1,753 +10.8% | $132,863 +3% |
| 2022 | $1,583 +1.5% | $128,994 +3% |
| 2021 | $1,559 +1.3% | $125,237 +1.4% |
| 2020 | $1,539 +1.7% | $123,508 +2.3% |
| 2019 | $1,513 +1.8% | $120,732 +1.9% |
| 2018 | $1,486 | $118,481 +2.1% |
| 2017 | $1,486 +1.8% | $116,045 +2.1% |
| 2016 | $1,460 +1.1% | $113,659 +9.2% |
| 2015 | $1,444 -33.2% | $104,046 +15.3% |
| 2014 | $2,160 | $90,231 +1.5% |
| 2013 | -- | $88,898 -11.8% |
| 2012 | -- | $100,756 -17.5% |
| 2011 | -- | $122,160 -9.9% |
| 2010 | -- | $135,522 +2.7% |
| 2009 | -- | $131,960 +5.7% |
| 2006 | -- | $124,868 +3% |
| 2005 | $1,788 | $121,231 +3% |
| 2004 | -- | $117,700 +488.5% |
| 2003 | $388 | $20,000 |
| 2002 | -- | $20,000 |
| 2001 | -- | $20,000 |
Find assessor info on the county website
BuyAbility℠ payment
Estimated monthly payment
All calculations are estimates and provided by Zillow, Inc. for informational purposes only. Actual amounts may vary.
HOA fees may include property taxes on listings classified as Co-Ops. Contact the listing agent and/or owner for fee details.
Mortgage interest rates are dependent on a number of factors, including credit score, down payment, and repayment length. Interest rate data provided by Zillow Group Marketplace, Inc. as of 1/1/1970 from various mortgage lenders with which we have lead or other similar arrangements; the Estimated Payment is an average of those rates.
See how much you could borrow to make a competitive offer.
Boost your down payment with 6% savings match
Earn up to a 6% match & get a competitive APY with a *. Zillow has partnered with to help get you home faster.
Learn more*Terms apply. Match provided by Foyer. Account offered by Pacific West Bank, Member FDIC.Climate risks
Neighborhood: McGirts Creek
Nearby schools
GreatSchools rating
- 5/10Sadie T. Tillis Elementary SchoolGrades: K-5Distance: 1.7 mi
- 2/10J. E. B. Stuart Middle SchoolGrades: 6-8Distance: 3 mi
- 2/10Westside High SchoolGrades: 9-12Distance: 1.8 mi


- Florida
- Duval County
- Jacksonville
- 32244
- McGirts Creek
- 7352 Governors Park Rd
Nearby cities
Nearby neighborhoods
Nearby zip codes
Other Jacksonville Topics
