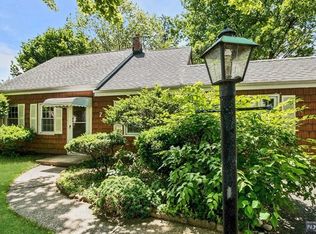
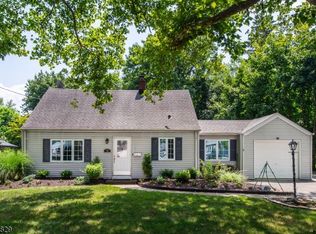
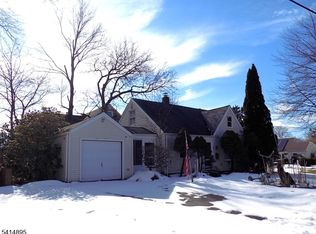
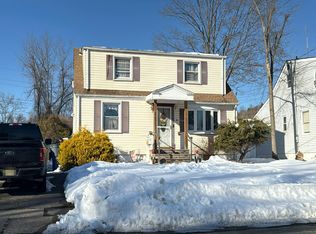
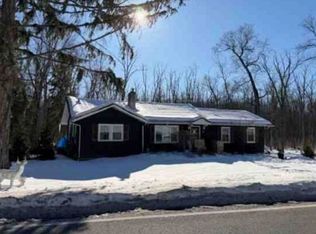
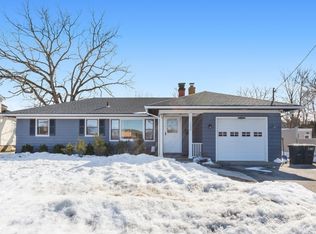
Renovated Village Cape with Custom Kitchen, Granite Counters, Updated Bath, Siding, Windows, Roof. Sunny & Bright LR, DR was BR and can easily be converted back. Den w/sliders to fabulous level rear yard. Loads of curb appeal on this Cape. Around the corner from Summer FUN at PV Park. Close to Rt. 23 for easy commute to NYC. Minutes to Shopping, Schools & almost everything in town. Subject to Short Sale Approval (sellers had this already before and should be easy to obtain again).Buyer responsible for all township permits, sewers coming, hook up & assessment on buyer.
Pre-foreclosure
Est. $559,100
72 Village Rd, Pompton Plains, NJ 07444
2beds
1baths
1,200sqft
SingleFamily
Built in 1952
10,454 Square Feet Lot
$559,100 Zestimate®
$466/sqft
$-- HOA
Overview
- 309 days |
- 24 |
- 0 |
Facts & features
Interior
Bedrooms & bathrooms
- Bedrooms: 2
- Bathrooms: 1
Heating
- Baseboard, Gas
Cooling
- Wall
Appliances
- Included: Range / Oven
Interior area
- Total interior livable area: 1,200 sqft
Property
Features
- Exterior features: Vinyl
Lot
- Size: 10,454 Square Feet
Details
- Parcel number: 3102306000000011
Construction
Type & style
- Home type: SingleFamily
Materials
- Roof: Other
Condition
- Year built: 1952
Community & HOA
Location
- Region: Pompton Plains
Financial & listing details
- Price per square foot: $466/sqft
- Tax assessed value: $518,100
- Annual tax amount: $9,455
Visit our professional directory to find a foreclosure specialist in your area that can help with your home search.
Find a foreclosure agentForeclosure details
Estimated market value
$559,100
$520,000 - $598,000
$2,812/mo
Price history
Price history
| Date | Event | Price |
|---|---|---|
| 7/19/2014 | Listing removed | $169,900$142/sqft |
Source: CENTURY 21 Crest Real Estate, Inc. #3143027 Report a problem | ||
| 5/22/2014 | Listed for sale | $169,900$142/sqft |
Source: BIRDVIEW Technologies. Inc. #3143027 Report a problem | ||
| 12/9/2013 | Listing removed | $169,900$142/sqft |
Source: Better Homes and Gardens Rand Realty #3009117 Report a problem | ||
| 10/16/2013 | Listed for sale | $169,900+0.5%$142/sqft |
Source: Better Homes and Gardens Rand Realty #3009117 Report a problem | ||
| 3/17/2013 | Listing removed | $169,000$141/sqft |
Source: Better Homes and Gardens Rand Realty #2960488 Report a problem | ||
| 1/4/2013 | Price change | $169,000-15.1%$141/sqft |
Source: Better Homes and Gardens Rand Realty #2960488 Report a problem | ||
| 12/6/2012 | Price change | $199,000-13.1%$166/sqft |
Source: Better Homes and Gardens Rand Realty #2960488 Report a problem | ||
| 10/16/2012 | Price change | $229,000-4.5%$191/sqft |
Source: BHG Rand Realty - Wayne #2960488 Report a problem | ||
| 8/14/2012 | Listed for sale | $239,900$200/sqft |
Source: BHG Rand Realty - Wayne #2960488 Report a problem | ||
| 6/26/2012 | Listing removed | $239,900$200/sqft |
Source: BHG Rand Realty - Wayne #2940940 Report a problem | ||
| 5/11/2012 | Listed for sale | $239,900-14.3%$200/sqft |
Source: BHG Rand Realty - Wayne #2940940 Report a problem | ||
| 11/18/2011 | Listing removed | $280,000$233/sqft |
Source: Realty Executives Exceptional Realtors #2880738 Report a problem | ||
| 8/18/2011 | Listed for sale | $280,000+3.7%$233/sqft |
Source: Realty Executives Exceptional Realtors #2880738 Report a problem | ||
| 9/17/2009 | Sold | $270,000$225/sqft |
Source: Public Record Report a problem | ||
Public tax history
Public tax history
| Year | Property taxes | Tax assessment |
|---|---|---|
| 2025 | $9,455 +1.9% | $518,100 +1.9% |
| 2024 | $9,278 -3.3% | $508,400 -2.6% |
| 2023 | $9,594 +21.9% | $522,000 +68.8% |
| 2022 | $7,869 +1.9% | $309,200 |
| 2021 | $7,721 +4.7% | $309,200 |
| 2020 | $7,374 +3.9% | $309,200 |
| 2019 | $7,096 +60.2% | $309,200 +55.1% |
| 2018 | $4,429 +3.3% | $199,400 |
| 2017 | $4,289 +0.5% | $199,400 |
| 2016 | $4,269 +2.4% | $199,400 |
| 2015 | $4,167 +0.7% | $199,400 |
| 2014 | $4,138 -1.3% | $199,400 |
| 2013 | $4,191 -27% | $199,400 |
| 2012 | $5,741 +0.8% | $199,400 -40% |
| 2011 | $5,697 +2.9% | $332,400 |
| 2010 | $5,534 +2.8% | $332,400 |
| 2009 | $5,385 | $332,400 |
| 2008 | -- | $332,400 |
| 2007 | -- | $332,400 |
| 2006 | -- | $332,400 +152.8% |
| 2005 | -- | $131,500 |
| 2004 | -- | $131,500 |
| 2003 | -- | $131,500 |
| 2002 | -- | $131,500 |
| 2001 | -- | $131,500 |
Find assessor info on the county website
BuyAbility℠ payment
Estimated monthly payment
Boost your down payment with 6% savings match
Earn up to a 6% match & get a competitive APY with a *. Zillow has partnered with to help get you home faster.
Learn more*Terms apply. Match provided by Foyer. Account offered by Pacific West Bank, Member FDIC.Climate risks
Neighborhood: 07444
Nearby schools
GreatSchools rating
- 6/10Hillview Elementary SchoolGrades: K-5Distance: 0.6 mi
- 6/10Pequannock Valley Middle SchoolGrades: 6-8Distance: 0.5 mi
- 8/10Pequannock Twp High SchoolGrades: 9-12Distance: 1 mi
Schools provided by the listing agent
- Elementary: Hillview
- Middle: Pequannock
- High: Pequannock
- District: Pequannock
Source: The MLS. This data may not be complete. We recommend contacting the local school district to confirm school assignments for this home.