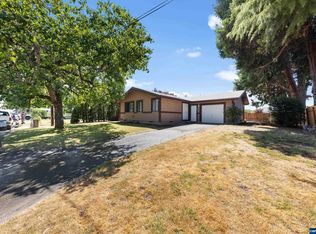
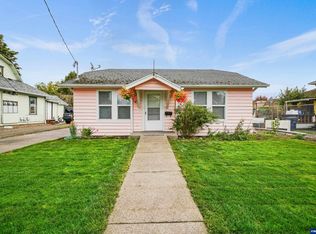
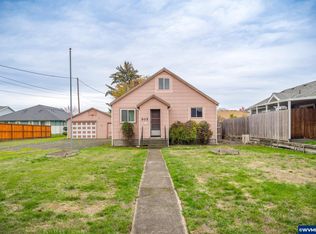
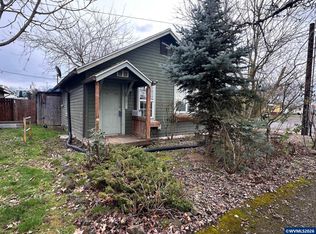
Accepted Offer with Contingencies. Single level home with full kitchen remodel (2016), and updated bathroom, living room and all new floors throughout the house. This home includes three bedrooms, one bathroom and is located less than one mile from Western Oregon University. Large, fenced backyard with room for boat or RV parking.
Pre-foreclosure
Est. $374,300
711 Bentley St E, Monmouth, OR 97361
3beds
1,014sqft
SingleFamily
Built in 1960
6,969 Square Feet Lot
$374,300 Zestimate®
$369/sqft
$-- HOA
Overview
- 254 days |
- 20 |
- 1 |
Facts & features
Interior
Bedrooms & bathrooms
- Bedrooms: 3
- Bathrooms: 1
- Full bathrooms: 1
Heating
- Baseboard
Appliances
- Included: Dishwasher
Features
- Flooring: Tile, Carpet
- Has fireplace: Yes
Interior area
- Total interior livable area: 1,014 sqft
Property
Parking
- Parking features: Garage - Attached
Features
- Exterior features: Shingle
Lot
- Size: 6,969 Square Feet
Details
- Parcel number: 192114
Construction
Type & style
- Home type: SingleFamily
Materials
- Roof: Other
Condition
- Year built: 1960
Community & HOA
Location
- Region: Monmouth
Financial & listing details
- Price per square foot: $369/sqft
- Tax assessed value: $318,720
- Annual tax amount: $2,575
Visit our professional directory to find a foreclosure specialist in your area that can help with your home search.
Find a foreclosure agentForeclosure details
Estimated market value
$374,300
$356,000 - $393,000
$1,961/mo
Price history
Price history
| Date | Event | Price |
|---|---|---|
| 10/20/2024 | Listing removed | $319,900-3%$315/sqft |
Source: | ||
| 10/19/2021 | Sold | $329,900+3.1%$325/sqft |
Source: Public Record Report a problem | ||
| 9/19/2021 | Contingent | $319,900$315/sqft |
Source: | ||
| 9/16/2021 | Listed for sale | $319,900+53.8%$315/sqft |
Source: | ||
| 1/8/2018 | Sold | $208,000-2.3%$205/sqft |
Source: Public Record Report a problem | ||
| 11/28/2017 | Price change | $213,000-2.3%$210/sqft |
Source: HOMESMART REALTY GROUP #722731 Report a problem | ||
| 10/31/2017 | Price change | $218,000-2%$215/sqft |
Source: HOMESMART REALTY GROUP #722731 Report a problem | ||
| 9/28/2017 | Price change | $222,500-2.2%$219/sqft |
Source: HOMESMART REALTY GROUP #722731 Report a problem | ||
| 9/11/2017 | Price change | $227,500-3.2%$224/sqft |
Source: HOMESMART REALTY GROUP #722731 Report a problem | ||
| 8/14/2017 | Listed for sale | $235,000+70.3%$232/sqft |
Source: HOMESMART REALTY GROUP #722731 Report a problem | ||
| 10/28/2013 | Sold | $138,000-4.1%$136/sqft |
Source: Public Record Report a problem | ||
| 9/1/2013 | Listed for sale | $143,900+2.9%$142/sqft |
Source: Owner Report a problem | ||
| 4/27/2006 | Sold | $139,900$138/sqft |
Source: Public Record Report a problem | ||
Public tax history
Public tax history
| Year | Property taxes | Tax assessment |
|---|---|---|
| 2024 | $2,575 -4% | $151,640 +3% |
| 2023 | $2,682 +11.1% | $147,230 +3% |
| 2022 | $2,414 +1.1% | $142,950 +3% |
| 2021 | $2,387 +4.1% | $138,790 +3% |
| 2020 | $2,292 +3% | $134,750 +3% |
| 2019 | $2,225 | $130,830 +3% |
| 2018 | $2,225 +3.6% | $127,020 +3% |
| 2017 | $2,149 +0.5% | $123,330 +3% |
| 2016 | $2,137 -1.3% | $119,740 +3% |
| 2015 | $2,165 +4.4% | $116,260 +3% |
| 2014 | $2,075 +10.6% | $112,880 +3% |
| 2013 | $1,876 +2.4% | $109,600 +3% |
| 2012 | $1,832 +3.1% | $106,410 +3% |
| 2011 | $1,776 +3.5% | $103,320 +3% |
| 2010 | $1,716 -0.3% | $100,320 +3% |
| 2009 | $1,722 +2.9% | $97,400 +3% |
| 2008 | $1,673 -0.8% | $94,570 +3% |
| 2007 | $1,687 +7.1% | $91,820 +3% |
| 2006 | $1,576 -1.5% | $89,150 +3% |
| 2005 | $1,599 +5.4% | $86,560 +3% |
| 2004 | $1,517 -0.2% | $84,040 +6.1% |
| 2002 | $1,519 +2.4% | $79,230 +3% |
| 2001 | $1,483 +14.7% | $76,930 +3% |
| 2000 | $1,293 | $74,690 |
Find assessor info on the county website
Monthly payment
Estimated monthly payment
All calculations are estimates and provided by Zillow, Inc. for informational purposes only. Actual amounts may vary.
HOA fees may include property taxes on listings classified as Co-Ops. Contact the listing agent and/or owner for fee details.
Mortgage interest rates are dependent on a number of factors, including credit score, down payment, and repayment length. Interest rate data provided by Zillow Group Marketplace, Inc. as of 1/1/1970 from various mortgage lenders with which we have lead or other similar arrangements; the Estimated Payment is an average of those rates.
See how much you could borrow to make a competitive offer.
Climate risks
Neighborhood: 97361
Nearby schools
GreatSchools rating
- 4/10Monmouth Elementary SchoolGrades: K-5Distance: 0.6 mi
- 4/10Talmadge Middle SchoolGrades: 6-8Distance: 1.1 mi
- 4/10Central High SchoolGrades: 9-12Distance: 1 mi


- Oregon
- Polk County
- Monmouth
- 97361
- 711 Bentley St E
Nearby cities
Nearby zip codes
Other Monmouth Topics
