$320,900
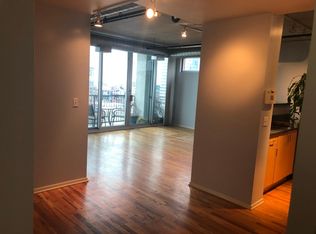
2 bd|2 ba|900 sqft
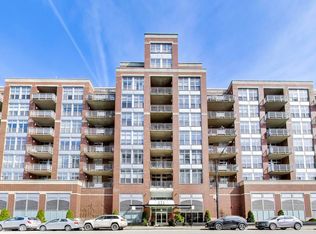
700 W Van Buren St APT 1003, Chicago, IL 60607
Off Market
Zillow last checked:
Listing updated:
Jessica Coulson 312-319-1168,
Compass,
Lauren Chapleau 347-306-7651,
Compass
Not available
Estimated sales range
Not available
Not available
| Date | Event | Price |
|---|---|---|
| 2/24/2026 | Contingent | $315,000$371/sqft |
Source: | ||
| 2/13/2026 | Listed for sale | $315,000+11.9%$371/sqft |
Source: | ||
| 4/17/2020 | Sold | $281,500-1.2%$331/sqft |
Source: | ||
| 3/5/2020 | Pending sale | $285,000$335/sqft |
Source: Redfin Corporation #10641737 Report a problem | ||
| 2/21/2020 | Listed for sale | $285,000+23.4%$335/sqft |
Source: Redfin Corporation #10641737 Report a problem | ||
| 9/13/2018 | Listing removed | $2,100$2/sqft |
Source: J-Hancok Report a problem | ||
| 9/11/2018 | Listed for rent | $2,100-10.6%$2/sqft |
Source: J-Hancok Report a problem | ||
| 5/13/2018 | Listing removed | $2,350$3/sqft |
Source: The Lathan-Rizzo Team - Fulton Grace Realty Report a problem | ||
| 5/11/2018 | Price change | $2,350-4.1%$3/sqft |
Source: The Lathan-Rizzo Team - Fulton Grace Realty Report a problem | ||
| 4/28/2018 | Listed for rent | $2,450$3/sqft |
Source: The Lathan-Rizzo Team - Fulton Grace Realty Report a problem | ||
| 8/5/2015 | Sold | $231,000+7.4%$272/sqft |
Source: | ||
| 5/29/2015 | Pending sale | $215,000$253/sqft |
Source: RE/MAX Exclusive Properties #08928737 Report a problem | ||
| 5/21/2015 | Listed for sale | $215,000-13.8%$253/sqft |
Source: RE/MAX Exclusive Properties #08928737 Report a problem | ||
| 1/25/2005 | Sold | $249,500+42.6%$294/sqft |
Source: Public Record Report a problem | ||
| 3/14/2002 | Sold | $175,000$206/sqft |
Source: Public Record Report a problem | ||
| Year | Property taxes | Tax assessment |
|---|---|---|
| 2023 | $4,767 +3.1% | $25,831 |
| 2022 | $4,625 +1.9% | $25,831 |
| 2021 | $4,540 -2.5% | $25,831 +7.9% |
| 2020 | $4,658 +1.5% | $23,944 -8.6% |
| 2019 | $4,591 +1.7% | $26,205 |
| 2018 | $4,512 +25.4% | $26,205 +30.8% |
| 2017 | $3,598 +2.4% | $20,032 |
| 2016 | $3,512 +10.1% | $20,032 |
| 2015 | $3,190 +23.4% | $20,032 +21.4% |
| 2014 | $2,584 +2.5% | $16,498 |
| 2013 | $2,522 +0.4% | $16,498 |
| 2012 | $2,513 -10% | $16,498 -14.3% |
| 2011 | $2,791 -10.4% | $19,246 -8.2% |
| 2010 | $3,116 +4.1% | $20,970 |
| 2009 | $2,992 -4.1% | $20,970 -3.6% |
| 2008 | $3,119 +1% | $21,742 |
| 2007 | $3,088 -1.1% | $21,742 |
| 2006 | $3,121 -5.1% | $21,742 +8% |
| 2005 | $3,289 +11.8% | $20,128 |
| 2004 | $2,942 +1.6% | $20,128 |
| 2003 | $2,896 | $20,128 |
Find assessor info on the county website
Source: MRED as distributed by MLS GRID. This data may not be complete. We recommend contacting the local school district to confirm school assignments for this home.
A local agent can set up tours, give advice and negotiate with sellers.
A local lender can help you make sure your offer is ready when you are.