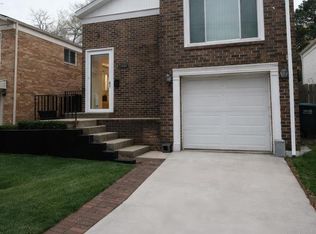
$240,000
3 bd|1 ba|1k sqft
72 Darrington St SW, Washington, DC 20032
Sold
Zillow last checked: 7 hours ago
Listing updated: March 19, 2026 at 03:47am
Lorielle M Akintunde 301-802-9906,
RLAH @properties
$532,600
$506,000 - $559,000
$4,052/mo
| Date | Event | Price |
|---|---|---|
| 12/6/2024 | Listing removed | $494,999$261/sqft |
Source: | ||
| 9/13/2024 | Listed for sale | $494,999-2.9%$261/sqft |
Source: | ||
| 2/7/2022 | Listing removed | $509,999$268/sqft |
Source: | ||
| 1/12/2022 | Contingent | $509,999$268/sqft |
Source: | ||
| 12/8/2021 | Price change | $509,999-1.9%$268/sqft |
Source: | ||
| 10/1/2021 | Listed for sale | $519,999+15.6%$274/sqft |
Source: | ||
| 7/25/2019 | Sold | $449,900$237/sqft |
Source: Public Record Report a problem | ||
| 6/10/2019 | Listed for sale | $449,900+126.1%$237/sqft |
Source: Keller Williams Preferred Properties #DCDC426806 Report a problem | ||
| 2/11/2019 | Sold | $199,000+2.1%$105/sqft |
Source: Public Record Report a problem | ||
| 11/19/2018 | Pending sale | $195,000$103/sqft |
Source: Taylor Properties #1004392415 Report a problem | ||
| 8/31/2018 | Listed for sale | $195,000$103/sqft |
Source: Taylor Properties #1004392415 Report a problem | ||
| 5/21/2018 | Pending sale | $195,000$103/sqft |
Source: Taylor Properties #1004392415 Report a problem | ||
| 5/2/2018 | Price change | $195,000+25.8%$103/sqft |
Source: Taylor Properties #1004392415 Report a problem | ||
| 1/5/2018 | Listed for sale | $155,000$82/sqft |
Source: Taylor Properties #1004392415 Report a problem | ||
| Year | Property taxes | Tax assessment |
|---|---|---|
| 2025 | $4,068 +4.1% | $568,390 +3.8% |
| 2024 | $3,908 +9.3% | $547,550 +3.6% |
| 2023 | $3,577 +8.6% | $528,680 +10.2% |
| 2022 | $3,293 +9.3% | $479,860 +4.5% |
| 2021 | $3,011 +9.8% | $459,260 +15.3% |
| 2020 | $2,743 -87.6% | $398,420 +80.8% |
| 2018 | $22,041 +105.4% | $220,410 +2.7% |
| 2017 | $10,732 +13.2% | $214,640 +13.2% |
| 2016 | $9,478 +20.4% | $189,560 +20.4% |
| 2015 | $7,869 +87.8% | $157,380 +2.5% |
| 2014 | $4,191 +458.8% | $153,470 -2.5% |
| 2013 | $750 -27.1% | $157,330 -16.5% |
| 2012 | $1,028 | $188,470 |
| 2011 | $1,028 +19.1% | $188,470 -25.8% |
| 2010 | $864 +98.6% | $253,990 -5.1% |
| 2009 | $435 +1.2% | $267,630 +48.3% |
| 2007 | $429 +5.2% | $180,490 +71.7% |
| 2006 | $408 -29.5% | $105,140 +5.4% |
| 2005 | $579 +12% | $99,730 +8.6% |
| 2004 | $517 -9.5% | $91,870 +2.6% |
| 2003 | $572 +0% | $89,540 |
| 2002 | $572 +14.8% | $89,540 +9.4% |
| 2001 | $498 | $81,846 |
Find assessor info on the county website
Source: Bright MLS. This data may not be complete. We recommend contacting the local school district to confirm school assignments for this home.