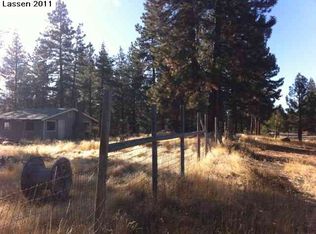
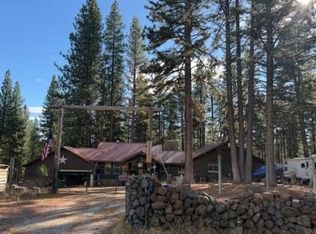
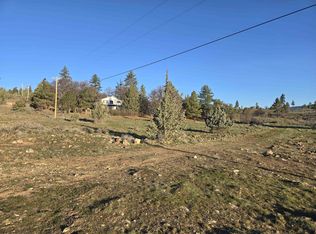
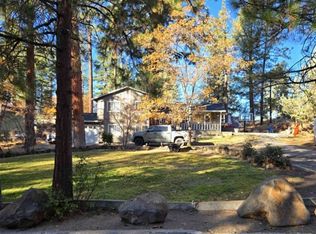
YOUR REFUGE FROM TOWN IS HERE! THIS BEAUTIFUL HOME FEATURES WHAT IS EASILY 3 MASTER SUITES FOR YOU TO CHOOSE FROM! HOME FEATURES HARDWOOD, TILE AND CARPET. UPDATED PANTRY IN OPEN KITCHEN WITH UPDATED LIGHTING. CUSTOM CABINETS IN LAUNDRY ROOM. LARGE SHOP/CRAFT AREA OFF OF GARAGE WITH NEW EPOXY FLOOR. WONDERFUL WALK IN CLOSET. TANK-LESS WATER HEATER. WHOLE HOUSE FILTER AND WATER SOFTENER. RV HOOK UPS! NEW CHICKEN COOP WITH RUN. OUTDOOR KITCHEN AND BBQ AREA. LARGE OPEN DECK TO ENJOY THE COOL SUMMER EVENINGS! ALSO INCLUDES 2 HEATED DOG HOUSES! THIS HOME IS A MUST SEE!
Foreclosed
Est. $389,900
692 River Bench Rd #200, Susanville, CA 96130
3beds
3baths
2,090sqft
SingleFamily
Built in 1963
2.46 Acres Lot
$389,900 Zestimate®
$187/sqft
$-- HOA
Overview
- 68 days |
- 53 |
- 0 |
Facts & features
Interior
Bedrooms & bathrooms
- Bedrooms: 3
- Bathrooms: 3
Heating
- Forced air, Wood / Pellet
Appliances
- Included: Dishwasher, Microwave, Range / Oven
- Laundry: Room, Washer/Dryer hookup-Elect
Features
- Flooring: Tile, Hardwood, Linoleum / Vinyl
- Has fireplace: Yes
Interior area
- Total interior livable area: 2,090 sqft
Property
Parking
- Total spaces: 2
- Parking features: Garage - Attached
Features
- Exterior features: Wood, Brick
Lot
- Size: 2.46 Acres
Details
- Parcel number: 099170025000
- Zoning: U-C-2
Construction
Type & style
- Home type: SingleFamily
Materials
- Roof: Metal
Condition
- Year built: 1963
Utilities & green energy
- Electric: LMUD
- Sewer: Septic
Community & HOA
Location
- Region: Susanville
Financial & listing details
- Price per square foot: $187/sqft
- Tax assessed value: $430,849
- Annual tax amount: $4,470
Visit our professional directory to find a foreclosure specialist in your area that can help with your home search.
Find a foreclosure agentForeclosure details
Estimated market value
$389,900
$370,000 - $409,000
$2,370/mo
Price history
Price history
| Date | Event | Price |
|---|---|---|
| 1/14/2026 | Sold | $339,100-15.2%$162/sqft |
Source: Public Record Report a problem | ||
| 10/1/2025 | Listing removed | $400,000$191/sqft |
Source: | ||
| 8/18/2025 | Price change | $400,000-1.7%$191/sqft |
Source: | ||
| 7/10/2025 | Price change | $407,000-1.2%$195/sqft |
Source: | ||
| 6/13/2025 | Listed for sale | $412,000+0.7%$197/sqft |
Source: | ||
| 12/21/2021 | Sold | $409,000$196/sqft |
Source: | ||
| 6/12/2021 | Price change | $409,000-2.4%$196/sqft |
Source: | ||
| 4/20/2021 | Listed for sale | $419,000+35.2%$200/sqft |
Source: | ||
| 6/28/2016 | Sold | $310,000-2.8%$148/sqft |
Source: | ||
| 4/20/2016 | Listed for sale | $319,000-3%$153/sqft |
Source: SMITH PROPERTIES #a389 Report a problem | ||
| 10/2/2015 | Listing removed | $329,000$157/sqft |
Source: Owner Report a problem | ||
| 9/28/2015 | Listed for sale | $329,000+31.6%$157/sqft |
Source: SMITH PROPERTIES Report a problem | ||
| 1/19/2005 | Sold | $250,000+61.3%$120/sqft |
Source: Public Record Report a problem | ||
| 2/14/2003 | Sold | $155,000$74/sqft |
Source: Public Record Report a problem | ||
Public tax history
Public tax history
| Year | Property taxes | Tax assessment |
|---|---|---|
| 2025 | $4,470 +2.2% | $430,849 +2% |
| 2024 | $4,373 +0.6% | $422,402 +2% |
| 2023 | $4,348 +3% | $414,120 +2% |
| 2022 | $4,220 +23.5% | $406,000 +19.8% |
| 2021 | $3,418 -1% | $339,028 +1% |
| 2020 | $3,452 +3.1% | $335,553 +2% |
| 2019 | $3,347 +3.7% | $328,974 +2% |
| 2018 | $3,228 -1.7% | $322,524 +2% |
| 2017 | $3,285 +18.8% | $316,200 +18.9% |
| 2016 | $2,765 +14.3% | $266,000 +10.8% |
| 2015 | $2,418 -0.1% | $240,000 |
| 2014 | $2,421 | $240,000 |
| 2013 | -- | $240,000 +29.7% |
| 2012 | -- | $185,000 -9.8% |
| 2011 | -- | $205,000 -23.6% |
| 2010 | -- | $268,500 +9.6% |
| 2009 | -- | $245,000 -7.7% |
| 2008 | -- | $265,301 +2% |
| 2007 | -- | $260,100 +2% |
| 2006 | -- | $255,000 +58.3% |
| 2005 | -- | $161,050 +2% |
| 2004 | -- | $157,893 +34% |
| 2003 | -- | $117,814 +4% |
| 2001 | -- | $113,241 |
Find assessor info on the county website
BuyAbility℠ payment
Estimated monthly payment
All calculations are estimates and provided by Zillow, Inc. for informational purposes only. Actual amounts may vary.
HOA fees may include property taxes on listings classified as Co-Ops. Contact the listing agent and/or owner for fee details.
Mortgage interest rates are dependent on a number of factors, including credit score, down payment, and repayment length. Interest rate data provided by Zillow Group Marketplace, Inc. as of 1/1/1970 from various mortgage lenders with which we have lead or other similar arrangements; the Estimated Payment is an average of those rates.
See how much you could borrow to make a competitive offer.
Boost your down payment with 6% savings match
Earn up to a 6% match & get a competitive APY with a *. Zillow has partnered with to help get you home faster.
Learn more*Terms apply. Match provided by Foyer. Account offered by Pacific West Bank, Member FDIC.Climate risks
Neighborhood: 96130
Getting around
0 / 100
Car-DependentNearby schools
GreatSchools rating
- 6/10Meadow View Elementary SchoolGrades: 3-5Distance: 4 mi
- 6/10Diamond View Middle SchoolGrades: 6-8Distance: 3.9 mi
- 4/10Lassen High SchoolGrades: 9-12Distance: 4.2 mi


- California
- Lassen County
- Susanville
- 96130
- 692 River Bench Rd Unit 200
Nearby cities
Nearby neighborhoods
Nearby zip codes
Other Susanville Topics
