$--
-- bd|-- ba|-- sqft
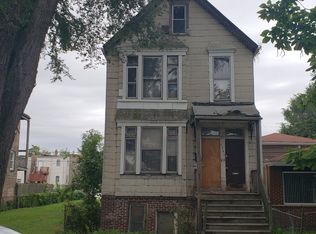
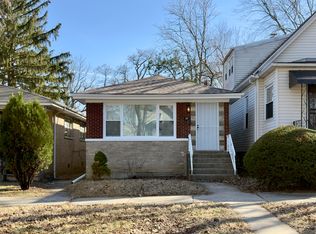
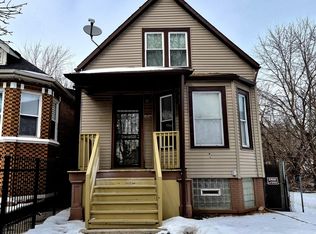
6540 S Carpenter St, Chicago, IL 60621
Off Market
Zillow last checked: 7 hours ago
Listing updated: March 22, 2026 at 10:06pm
Ronny Picado 773-745-1000,
Chicagoland Brokers, Inc.
Not available
Estimated sales range
Not available
Not available
| Date | Event | Price |
|---|---|---|
| 3/17/2026 | Listed for sale | $259,900+136.3%$274/sqft |
Source: | ||
| 12/5/2025 | Sold | $110,000+0.1%$116/sqft |
Source: | ||
| 11/25/2025 | Contingent | $109,900$116/sqft |
Source: | ||
| 11/18/2025 | Price change | $109,900-8.3%$116/sqft |
Source: | ||
| 10/31/2025 | Listed for sale | $119,900$126/sqft |
Source: | ||
| 10/29/2025 | Contingent | $119,900$126/sqft |
Source: | ||
| 10/24/2025 | Listed for sale | $119,900$126/sqft |
Source: | ||
| 9/17/2025 | Contingent | $119,900$126/sqft |
Source: | ||
| 8/27/2025 | Listed for sale | $119,900+124.1%$126/sqft |
Source: | ||
| 3/29/2024 | Listing removed | -- |
Source: | ||
| 1/10/2024 | Pending sale | $53,500$56/sqft |
Source: | ||
| 1/2/2024 | Listed for sale | $53,500$56/sqft |
Source: | ||
| 10/5/2023 | Pending sale | $53,500$56/sqft |
Source: | ||
| 9/28/2023 | Listed for sale | $53,500-28.7%$56/sqft |
Source: | ||
| 8/7/2020 | Listing removed | $1,500$2/sqft |
Source: Rose Realty Group #10756532 Report a problem | ||
| 6/23/2020 | Listed for rent | $1,500$2/sqft |
Source: Rose Realty Group #10756532 Report a problem | ||
| 12/31/2019 | Sold | $75,000$79/sqft |
Source: Public Record Report a problem | ||
| Year | Property taxes | Tax assessment |
|---|---|---|
| 2023 | $1,055 +2.6% | $4,999 |
| 2022 | $1,028 +2.3% | $4,999 |
| 2021 | $1,005 -25.2% | $4,999 -17.1% |
| 2020 | $1,344 +104.3% | $6,031 -10% |
| 2019 | $658 +1.9% | $6,702 |
| 2018 | $645 -54.3% | $6,702 -32.5% |
| 2017 | $1,412 -5.2% | $9,934 |
| 2016 | $1,490 +11.2% | $9,934 |
| 2015 | $1,340 +30.8% | $9,934 +22.8% |
| 2014 | $1,024 +3.2% | $8,088 |
| 2013 | $993 -1.1% | $8,088 |
| 2012 | $1,004 -0.5% | $8,088 -21.2% |
| 2011 | $1,009 +14.5% | $10,266 |
| 2010 | $882 +19.8% | $10,266 |
| 2009 | $736 -7.3% | $10,266 -16.2% |
| 2008 | $794 +14.4% | $12,247 |
| 2007 | $694 +0.8% | $12,247 |
| 2006 | $688 -5.1% | $12,247 +59.3% |
| 2005 | $726 +1.9% | $7,690 |
| 2004 | $712 +4.5% | $7,690 |
| 2003 | $682 -5.4% | $7,690 +31.8% |
| 2002 | $721 +9.2% | $5,833 |
| 2001 | $660 -32.4% | $5,833 |
| 2000 | $976 +67.3% | $5,833 +14.8% |
| 1999 | $583 | $5,079 |
Find assessor info on the county website
Source: MRED as distributed by MLS GRID. This data may not be complete. We recommend contacting the local school district to confirm school assignments for this home.