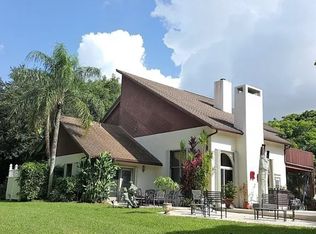
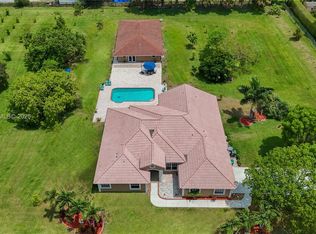
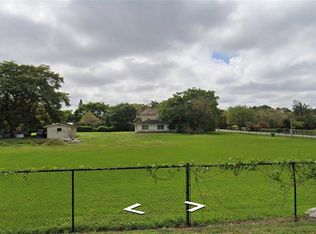
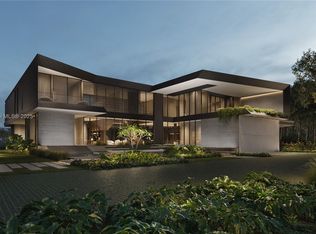
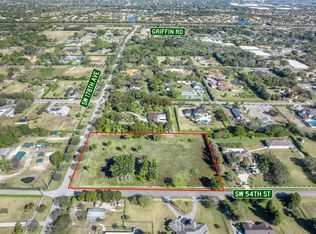
BUILD your Custom Home on the most beautiful lot in Southwest Ranches! This exceptional 3.25-acre corner lot, perfectly positioned at Melaleuca Road and Luray Road, offers a perfect canvas for your dream estate. Enter through a private, gated entrance framed by majestic mature oaks, setting the tone for the exclusivity. Located in Broward County’s most coveted and fastest-growing luxury enclave—home to elite athletes, entertainers, and top-tier executives. Unlike most parcels in the area, this property has been upgraded with city water access—saving time and expense. Architectural and engineering plans for a custom estate are available to qualified purchasers.
Lot/land
$3,750,000
6541 Melaleuca Road, Southwest Ranches, FL 33330
--beds
--baths
3.25Acres
Unimproved Land
Built in ----
3.25 Acres Lot
$3,206,000 Zestimate®
$--/sqft
$-- HOA
What's special
- 84 days |
- 342 |
- 10 |
Zillow last checked: 7 hours ago
Listing updated: February 26, 2026 at 10:01pm
Listed by:
Kyle Sorel 954-562-2032,
Native Realty Co.
Source: BeachesMLS,MLS#: F10543145 Originating MLS: BeachesMLS
Facts & features
Interior
Video & virtual tour
Property
Features
- Fencing: Fenced
Lot
- Size: 3.25 Acres
- Dimensions: 141748
- Features: Cleared
- Residential vegetation: Other
Details
- Additional structures: Barn(s)
- Parcel number: 514002010137
- Zoning: RR
Community & HOA
Community
- Subdivision: Everglades Sugar & Land C
HOA
- Has HOA: No
Location
- Region: Fort Lauderdale
Financial & listing details
- Tax assessed value: $2,524,410
- Annual tax amount: $45,231
- Date on market: 1/2/2026
- Cumulative days on market: 322 days
- Listing terms: Cash,Conventional,Cryptocurrency
Estimated market value
$3,206,000
$2.66M - $3.82M
$8,183/mo
Price history
Price history
| Date | Event | Price |
|---|---|---|
| 10/6/2025 | Price change | $3,750,000-6% |
Source: | ||
| 5/7/2025 | Listed for sale | $3,990,000+35.3% |
Source: | ||
| 10/6/2023 | Sold | $2,950,000-0.8% |
Source: | ||
| 9/26/2023 | Pending sale | $2,975,000 |
Source: | ||
| 9/25/2023 | Price change | $2,975,000+6.4% |
Source: | ||
| 9/16/2023 | Listed for sale | $2,795,000+56.1% |
Source: | ||
| 4/20/2022 | Sold | $1,790,000 |
Source: | ||
| 3/21/2022 | Pending sale | $1,790,000 |
Source: | ||
| 3/1/2022 | Contingent | $1,790,000 |
Source: | ||
| 1/1/2022 | Listed for sale | $1,790,000+32.6% |
Source: | ||
| 11/5/2021 | Sold | $1,350,000-3.6% |
Source: | ||
| 9/27/2021 | Contingent | $1,399,900 |
Source: | ||
| 9/13/2021 | Listed for sale | $1,399,900+1916.3% |
Source: | ||
| 4/1/1984 | Sold | $69,429 |
Source: Public Record Report a problem | ||
Public tax history
Public tax history
| Year | Property taxes | Tax assessment |
|---|---|---|
| 2024 | $45,231 +51.8% | $2,524,410 +58.4% |
| 2023 | $29,788 +49.2% | $1,593,750 +52.3% |
| 2022 | $19,959 +51.7% | $1,046,730 +44.6% |
| 2021 | $13,159 +1.3% | $724,000 +1.4% |
| 2020 | $12,988 -0.1% | $714,010 +2.3% |
| 2019 | $13,006 | $697,960 +199.5% |
| 2018 | $13,006 +194.8% | $233,050 +2.1% |
| 2017 | $4,412 +9.8% | $228,260 +2.1% |
| 2016 | $4,019 -6.1% | $223,570 +0.7% |
| 2015 | $4,278 +7.4% | $222,020 +0.8% |
| 2014 | $3,983 | $220,260 |
| 2013 | $3,983 -98.4% | -- |
| 2012 | $245,760 | $2,012 +0% |
| 2011 | $245,760 +6145.6% | $2,011 -99% |
| 2010 | $3,935 -4.6% | $204,120 +2.7% |
| 2009 | $4,125 +6.5% | $198,760 +0.1% |
| 2008 | $3,872 -2.2% | $198,570 +3% |
| 2007 | $3,959 +8.3% | $192,790 +2.5% |
| 2006 | $3,656 | $188,090 +11.9% |
| 2005 | -- | $168,120 +3% |
| 2004 | $3,362 +0.5% | $163,230 +1.9% |
| 2003 | $3,345 +0.2% | $160,190 +2.4% |
| 2002 | $3,340 +0.5% | $156,440 +1.6% |
| 2001 | $3,322 -6% | $153,980 |
| 2000 | $3,536 | -- |
Find assessor info on the county website
BuyAbility℠ payment
Estimated monthly payment
All calculations are estimates and provided by Zillow, Inc. for informational purposes only. Actual amounts may vary.
HOA fees may include property taxes on listings classified as Co-Ops. Contact the listing agent and/or owner for fee details.
Mortgage interest rates are dependent on a number of factors, including credit score, down payment, and repayment length. Interest rate data provided by Zillow Group Marketplace, Inc. as of 1/1/1970 from various mortgage lenders with which we have lead or other similar arrangements; the Estimated Payment is an average of those rates.
See how much you could borrow to make a competitive offer.
Boost your down payment with 6% savings match
Earn up to a 6% match & get a competitive APY with a *. Zillow has partnered with to help get you home faster.
Learn more*Terms apply. Match provided by Foyer. Account offered by Pacific West Bank, Member FDIC.Climate risks
Neighborhood: 33330
Nearby schools
GreatSchools rating
- 9/10Hawkes Bluff Elementary SchoolGrades: PK-5Distance: 2.5 mi
- 7/10Silver Trail Middle SchoolGrades: 6-8Distance: 4.4 mi
- 6/10Cooper City High SchoolGrades: 9-12Distance: 3 mi
Local experts in 33330


- Florida
- Broward County
- Southwest Ranches
- 33330
- 6541 Melaleuca Road
Nearby cities
Nearby zip codes
Other Southwest Ranches Topics
- Apartments for Rent in 33330
- Houses for Sale in 33330
- Houses for Rent in 33330
- 33330 Real Estate
- Southwest Ranches Condos
- Houses for Sale in Southwest Ranches
- Newest Listings in Southwest Ranches
- Southwest Ranches Home Values
- Southwest Ranches Real Estate Agents
- Southwest Ranches Refinance
- Southwest Ranches Mortgage Rates
