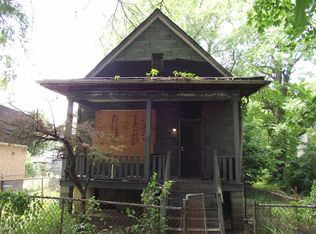
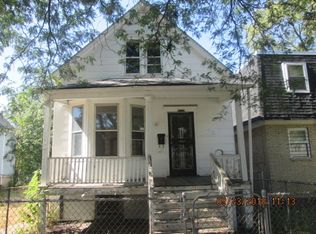
Remarks: Excellent opportunity add sweat equity to this solid frame single-family home in Englewood. This property is in need of a full renovation but has excellent potential. No access for showings or inspections due to condition. Sold As Is. Seller does not provide survey. Must take subject to all violations/housing case/municipal requirements. Auction terms apply.
Auction

Est. $15,000
6530 S Carpenter St, Chicago, IL 60621
3beds
1,546sqft
Single Family Residence
Built in 1900
3,049.2 Square Feet Lot
$73,800 Zestimate®
$10/sqft
$-- HOA
Overview
- 350 days |
- 674 |
- 29 |
Zillow last checked: March 20, 2026 at 12:14am
Listed by:
ANTHONY DISANO,
PARKVUE REALTY CORPORATION
Source: Xome,MLS#: 12276783
Facts & features
Interior
Bedrooms & bathrooms
- Bedrooms: 3
- Bathrooms: 2
- Full bathrooms: 2
Features
- Has basement: No
Interior area
- Total structure area: 1,546
- Total interior livable area: 1,546 sqft
Property
Lot
- Size: 3,049.2 Square Feet
Details
- Parcel number: 2020218037
- Special conditions: Auction
Construction
Type & style
- Home type: SingleFamily
- Property subtype: Single Family Residence
Condition
- Year built: 1900
Community & HOA
Location
- Region: Chicago
Financial & listing details
- Price per square foot: $10/sqft
- Tax assessed value: $29,990
- Annual tax amount: $633
- Date on market: 4/4/2025
- Lease term: Contact For Details
This listing is brought to you by Xome
View Auction DetailsForeclosure details
Estimated market value
$73,800
$53,000 - $103,000
$1,968/mo
Public tax history
Public tax history
| Year | Property taxes | Tax assessment |
|---|---|---|
| 2023 | $633 +2.6% | $2,999 |
| 2022 | $617 +2.3% | $2,999 |
| 2021 | $603 -54.6% | $2,999 -49.7% |
| 2020 | $1,328 -0.2% | $5,963 -10% |
| 2019 | $1,331 +1.7% | $6,626 |
| 2018 | $1,309 +145.6% | $6,626 -40.3% |
| 2017 | $533 +15.1% | $11,106 |
| 2016 | $463 +20.4% | $11,106 |
| 2015 | $384 -79.8% | $11,106 +8.2% |
| 2014 | $1,905 +364.4% | $10,268 |
| 2013 | $410 +21.4% | $10,268 |
| 2012 | $338 -64.4% | $10,268 -13.9% |
| 2011 | $950 +34.3% | $11,920 |
| 2010 | $707 +36.8% | $11,920 |
| 2009 | $517 -24.7% | $11,920 +3.7% |
| 2008 | $686 +87.4% | $11,497 |
| 2007 | $366 +0.8% | $11,497 |
| 2006 | $363 -5.2% | $11,497 +53.4% |
| 2005 | $383 +1.9% | $7,493 |
| 2004 | $376 +4.5% | $7,493 |
| 2003 | $360 -5.4% | $7,493 +90.2% |
| 2002 | $380 -44.3% | $3,940 |
| 2001 | $682 +3.5% | $3,940 |
| 2000 | $659 -0.7% | $3,940 +14.8% |
| 1999 | $664 | $3,432 |
Find assessor info on the county website
Climate risks
Neighborhood: Englewood
Nearby schools
GreatSchools rating
- 6/10Bass Elementary SchoolGrades: PK-8Distance: 0.1 mi
- NAEXCEL ACADEMY - ENGLEWOOD HSGrades: 9-12Distance: 0.8 mi
- Illinois
- Cook County
- Chicago
- 60621
- Englewood
- 6530 S Carpenter St
Nearby cities
Nearby neighborhoods
Nearby zip codes
Other Chicago Topics
