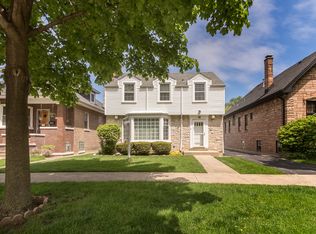
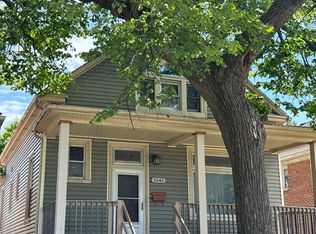
GREAT BRICK BUNGALOW IN VERY GOOD CONDITION, HARDWOOD FLOORS, CHARMING KITCHEN WITH TABLE SPACE, ONE AND HALF BATHROOMS, CENTRAL AIR, NEW ROOF, NEW WINDOWS, FINISHED BASEMENT, FINISHED ATTIC. 2 1/2 CAR GARAGE WITH EDO, LOCATED ON LOVELY TREE LINED STREET. CLOSE TO SCHOOLS, SHOPPING AND TRANSPORTATION.
Foreclosed
Est. $330,800
6519 33rd St, Berwyn, IL 60402
3beds
1,300sqft
SingleFamily
Built in 1925
3,720 Square Feet Lot
$330,800 Zestimate®
$254/sqft
$-- HOA
Overview
- 50 days |
- 10 |
- 0 |
Facts & features
Interior
Bedrooms & bathrooms
- Bedrooms: 3
- Bathrooms: 2
- Full bathrooms: 1
- 1/2 bathrooms: 1
Heating
- Forced air, Gas
Cooling
- Central
Appliances
- Included: Dryer, Microwave, Range / Oven, Refrigerator, Washer
Features
- Flooring: Tile, Hardwood, Linoleum / Vinyl
Interior area
- Total interior livable area: 1,300 sqft
Property
Parking
- Parking features: Garage - Detached
Features
- Exterior features: Brick
Lot
- Size: 3,720 Square Feet
Details
- Parcel number: 1631219029
Construction
Type & style
- Home type: SingleFamily
Materials
- Roof: Asphalt
Condition
- Year built: 1925
Community & HOA
Location
- Region: Berwyn
Financial & listing details
- Price per square foot: $254/sqft
- Tax assessed value: $254,800
- Annual tax amount: $9,109
Visit our professional directory to find a foreclosure specialist in your area that can help with your home search.
Find a foreclosure agentForeclosure details
Estimated market value
$330,800
$314,000 - $347,000
$2,497/mo
Price history
Price history
| Date | Event | Price |
|---|---|---|
| 5/10/2022 | Sold | $280,000$215/sqft |
Source: | ||
| 3/17/2022 | Contingent | $280,000$215/sqft |
Source: | ||
| 3/15/2022 | Listed for sale | $280,000$215/sqft |
Source: | ||
| 2/23/2022 | Contingent | $280,000$215/sqft |
Source: | ||
| 2/17/2022 | Listed for sale | $280,000+35.9%$215/sqft |
Source: | ||
| 12/22/2015 | Sold | $206,000-4.1%$158/sqft |
Source: | ||
| 10/15/2015 | Price change | $214,900-1.9%$165/sqft |
Source: RE/MAX Partners #09064045 Report a problem | ||
| 9/2/2015 | Price change | $219,000-4.4%$168/sqft |
Source: CENTURY 21 Affiliated #09014992 Report a problem | ||
| 7/22/2015 | Price change | $229,000-4.5%$176/sqft |
Source: CENTURY 21 Affiliated #09014992 Report a problem | ||
| 6/30/2015 | Price change | $239,900-4%$185/sqft |
Source: CENTURY 21 Affiliated #08904693 Report a problem | ||
| 6/2/2015 | Price change | $249,900-3.8%$192/sqft |
Source: CENTURY 21 Affiliated #08904693 Report a problem | ||
| 4/28/2015 | Listed for sale | $259,900$200/sqft |
Source: Century 21 Affiliated #08904693 Report a problem | ||
Public tax history
Public tax history
| Year | Property taxes | Tax assessment |
|---|---|---|
| 2023 | $9,109 +49% | $25,480 +51% |
| 2022 | $6,115 +2.4% | $16,877 |
| 2021 | $5,972 +4.1% | $16,877 |
| 2020 | $5,739 +18.5% | $16,877 +19% |
| 2019 | $4,845 +1.5% | $14,179 -3.5% |
| 2018 | $4,774 -32.4% | $14,689 -25.2% |
| 2017 | $7,064 +47.7% | $19,645 +45.2% |
| 2016 | $4,783 +3.2% | $13,527 |
| 2015 | $4,635 +3.2% | $13,527 |
| 2014 | $4,493 -5.3% | $13,527 -13.5% |
| 2013 | $4,746 +4.3% | $15,647 |
| 2012 | $4,552 +2.8% | $15,647 |
| 2011 | $4,427 +3.2% | $15,647 -16.3% |
| 2010 | $4,289 +8.4% | $18,694 |
| 2009 | $3,956 +12.7% | $18,694 -15% |
| 2008 | $3,512 -0.2% | $21,992 +5% |
| 2007 | $3,518 +7.7% | $20,937 |
| 2006 | $3,265 +3.9% | $20,937 |
| 2005 | $3,142 -6.8% | $20,937 +41.1% |
| 2004 | $3,373 +2.4% | $14,842 |
| 2003 | $3,294 +3.1% | $14,842 |
| 2002 | $3,195 +18.9% | $14,842 +23.8% |
| 2001 | $2,688 -0.8% | $11,991 |
| 2000 | $2,709 +10.3% | $11,991 |
| 1999 | $2,455 | $11,991 |
Find assessor info on the county website
BuyAbility℠ payment
Estimated monthly payment
All calculations are estimates and provided by Zillow, Inc. for informational purposes only. Actual amounts may vary.
HOA fees may include property taxes on listings classified as Co-Ops. Contact the listing agent and/or owner for fee details.
Mortgage interest rates are dependent on a number of factors, including credit score, down payment, and repayment length. Interest rate data provided by Zillow Group Marketplace, Inc. as of 1/1/1970 from various mortgage lenders with which we have lead or other similar arrangements; the Estimated Payment is an average of those rates.
See how much you could borrow to make a competitive offer.
Boost your down payment with 6% savings match
Earn up to a 6% match & get a competitive APY with a *. Zillow has partnered with to help get you home faster.
Learn more*Terms apply. Match provided by Foyer. Account offered by Pacific West Bank, Member FDIC.Climate risks
Neighborhood: 60402
Nearby schools
GreatSchools rating
- 5/10Emerson Elementary SchoolGrades: K-5Distance: 0.5 mi
- 8/10Heritage Middle SchoolGrades: 6-8Distance: 0.5 mi
- 4/10J Sterling Morton West High SchoolGrades: 9-12Distance: 1.2 mi
- Illinois
- Cook County
- Berwyn
- 60402
- 6519 33rd St
Nearby cities
Nearby zip codes
Other Berwyn Topics
