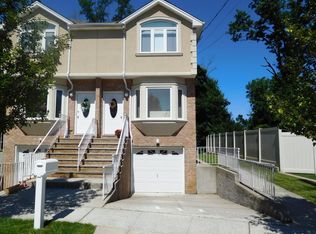
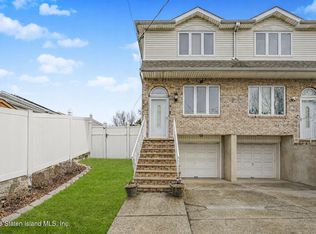
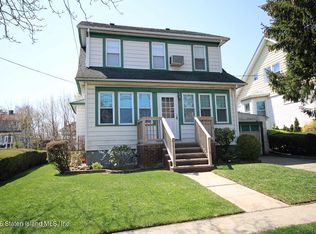
Welcome to this stunning and well-maintained townhouse located in the Staten Island Mall area! This young home offers 3 bedrooms, 4 bathrooms, and a built-in garage with private driveway. Full finished basement with front access.
For sale
$839,000
65 Gwenn Loop, Staten Island, NY 10314
3beds
1,400sqft
Single Family Residence
Built in 2005
3,484.8 Square Feet Lot
$837,300 Zestimate®
$599/sqft
$103/mo HOA
What's special
Private drivewayFull finished basementBuilt-in garageFront access
- 183 days |
- 453 |
- 7 |
Zillow last checked:
Listing updated:
Listing by:
E-House Realty of Avenue U Inc 718-680-2776,
Hui Chen 917-209-5098
Source: SIBOR,MLS#: 2506048
Tour with a local agent
Facts & features
Interior
Bedrooms & bathrooms
- Bedrooms: 3
- Bathrooms: 4
- Full bathrooms: 1
- 3/4 bathrooms: 3
Heating
- Forced Air, Natural Gas
Cooling
- Central Air
Interior area
- Total structure area: 1,400
- Total interior livable area: 1,400 sqft
Video & virtual tour
Property
Parking
- Total spaces: 1
- Parking features: Off Street
- Attached garage spaces: 1
Features
- Stories: 2
Lot
- Size: 3,484.8 Square Feet
- Dimensions: 26 x 136
- Features: Back, Front, Side
Details
- Parcel number: 019650082
- Zoning: R3-2
Construction
Type & style
- Home type: SingleFamily
- Architectural style: Colonial
- Property subtype: Single Family Residence
- Attached to another structure: Yes
Materials
- Vinyl Siding
Condition
- New construction: No
- Year built: 2005
Utilities & green energy
- Sewer: Public Sewer
Community & HOA
HOA
- Has HOA: Yes
- HOA fee: $103 monthly
Location
- Region: Staten Island
Financial & listing details
- Price per square foot: $599/sqft
- Tax assessed value: $827,000
- Annual tax amount: $8,243
- Date on market: 10/13/2025
- Listing agreement: Exclusive Right To Sell
Estimated market value
$837,300
$795,000 - $879,000
$3,824/mo
Price history
Price history
| Date | Event | Price |
|---|---|---|
| 10/13/2025 | Listed for sale | $839,000+33.7%$599/sqft |
Source: | ||
| 4/26/2021 | Sold | $627,500$448/sqft |
Source: Public Record Report a problem | ||
| 2/11/2021 | Sold | $627,500-1%$448/sqft |
Source: | ||
| 9/24/2020 | Listing removed | $634,065$453/sqft |
Source: DiTommaso Real Estate #1140221 Report a problem | ||
| 9/4/2020 | Listed for sale | $634,065+18.1%$453/sqft |
Source: DiTommaso Real Estate #1140221 Report a problem | ||
| 8/10/2012 | Listing removed | $537,000$384/sqft |
Source: Our Island Real Estate, Inc. #1076057 Report a problem | ||
| 6/21/2012 | Price change | $537,000-6.6%$384/sqft |
Source: Our Island Real Estate, Inc. #1076057 Report a problem | ||
| 6/18/2012 | Listed for sale | $575,000-0.7%$411/sqft |
Source: Our Island Real Estate Report a problem | ||
| 3/18/2011 | Listing removed | $579,000$414/sqft |
Source: Comfort Homes Realty Group Report a problem | ||
| 12/7/2010 | Price change | $579,000+0.7%$414/sqft |
Source: HomeSeekerUSA.com #1065005 Report a problem | ||
| 11/26/2010 | Price change | $575,000-2.4%$411/sqft |
Source: United National Realty #1063624 Report a problem | ||
| 9/24/2010 | Listed for sale | $589,000$421/sqft |
Source: United National Realty #1063624 Report a problem | ||
Public tax history
Public tax history
| Year | Property taxes | Tax assessment |
|---|---|---|
| 2025 | $8,243 +0.8% | $49,620 +20.6% |
| 2024 | $8,181 | $41,160 -4.9% |
| 2023 | -- | $43,260 +4.6% |
| 2022 | -- | $41,340 -5.1% |
| 2021 | -- | $43,560 +4.2% |
| 2020 | $7,239 +0.8% | $41,820 +5.3% |
| 2019 | $7,185 | $39,720 +24% |
| 2018 | -- | $32,022 +6% |
| 2017 | $6,158 +1.3% | $30,210 -0.7% |
| 2016 | $6,082 | $30,422 +1% |
| 2015 | $6,082 +6.5% | $30,120 +1.2% |
| 2014 | $5,711 | $29,760 -6.4% |
| 2013 | -- | $31,800 +3.3% |
| 2012 | -- | $30,780 |
| 2011 | -- | $30,780 +5.8% |
| 2010 | -- | $29,100 +1.7% |
| 2009 | -- | $28,620 -3.6% |
| 2008 | -- | $29,700 |
Find assessor info on the county website
Monthly payment
Estimated monthly payment
All calculations are estimates and provided by Zillow, Inc. for informational purposes only. Actual amounts may vary.
HOA fees may include property taxes on listings classified as Co-Ops. Contact the listing agent and/or owner for fee details.
Mortgage interest rates are dependent on a number of factors, including credit score, down payment, and repayment length. Interest rate data provided by Zillow Group Marketplace, Inc. as of 1/1/1970 from various mortgage lenders with which we have lead or other similar arrangements; the Estimated Payment is an average of those rates.
See how much you could borrow to make a competitive offer.
Climate risks
Neighborhood: New Springville
Nearby schools
GreatSchools rating
- 7/10Ps 54 Charles W LengGrades: PK-5Distance: 1 mi
- 6/10Is 72 Rocco LaurieGrades: 6-8Distance: 0.8 mi
- 5/10Susan E Wagner High SchoolGrades: 9-12Distance: 1.1 mi
A local agent can set up tours, give advice and negotiate with sellers.
Nearby cities
Nearby neighborhoods
Nearby zip codes
Other New York Topics
