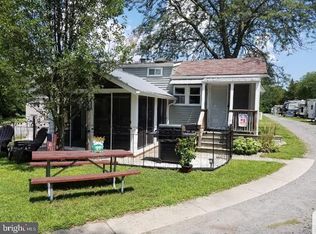
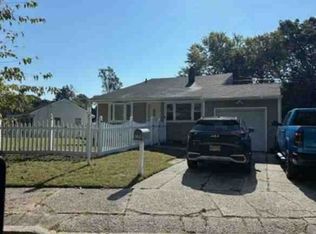
This is a 2139 square foot, 0.0 bathroom, single family home. This home is located at 639 Chestnut Neck Rd, Port Republic, NJ 08241.
Foreclosed
Est. $286,300
639 Chestnut Neck Rd, Port Republic, NJ 08241
--beds
0baths
2,139sqft
SingleFamily
Built in 1930
2.02 Acres Lot
$286,300 Zestimate®
$134/sqft
$-- HOA
Overview
- 41 days |
- 21 |
- 1 |
Facts & features
Interior
Bedrooms & bathrooms
- Bathrooms: 0
Interior area
- Total interior livable area: 2,139 sqft
Property
Features
- Exterior features: Wood
Lot
- Size: 2.02 Acres
Details
- Parcel number: 2000006000000011
Construction
Type & style
- Home type: SingleFamily
Condition
- Year built: 1930
Community & HOA
Location
- Region: Port Republic
Financial & listing details
- Price per square foot: $134/sqft
- Tax assessed value: $196,000
- Annual tax amount: $6,623
Visit our professional directory to find a foreclosure specialist in your area that can help with your home search.
Find a foreclosure agentForeclosure details
Estimated market value
$286,300
$189,000 - $412,000
$2,840/mo
Price history
Price history
| Date | Event | Price |
|---|---|---|
| 1/22/2026 | Sold | $1,000-98.9% |
Source: Public Record Report a problem | ||
| 1/19/2018 | Listing removed | $94,797$44/sqft |
Source: Auction.com Report a problem | ||
| 11/15/2017 | Listed for sale | -- |
Source: Auction.com Report a problem | ||
Public tax history
Public tax history
| Year | Property taxes | Tax assessment |
|---|---|---|
| 2025 | $6,623 | $196,000 |
| 2024 | $6,623 +9.7% | $196,000 |
| 2023 | $6,035 +8.3% | $196,000 |
| 2022 | $5,570 +2.5% | $196,000 |
| 2021 | $5,437 +3.5% | $196,000 |
| 2020 | $5,255 +0% | $196,000 |
| 2019 | $5,253 +1.7% | $196,000 |
| 2018 | $5,167 -0.2% | $196,000 |
| 2017 | $5,178 +0.3% | $196,000 +40.7% |
| 2016 | $5,161 +2.3% | $139,300 |
| 2015 | $5,045 +4.1% | $139,300 |
| 2014 | $4,849 +5.5% | $139,300 |
| 2013 | $4,598 +1% | $139,300 |
| 2012 | $4,554 +2.5% | $139,300 |
| 2011 | $4,441 +1% | $139,300 |
| 2010 | $4,398 +1.1% | $139,300 |
| 2009 | $4,349 +1.5% | $139,300 |
| 2008 | $4,283 +3.6% | $139,300 |
| 2007 | $4,136 | $139,300 |
| 2006 | -- | $139,300 |
| 2005 | -- | $139,300 |
| 2004 | -- | $139,300 |
| 2003 | -- | $139,300 |
| 2002 | -- | $139,300 |
| 2001 | -- | $139,300 |
Find assessor info on the county website
BuyAbility℠ payment
Estimated monthly payment
Boost your down payment with 6% savings match
Earn up to a 6% match & get a competitive APY with a *. Zillow has partnered with to help get you home faster.
Learn more*Terms apply. Match provided by Foyer. Account offered by Pacific West Bank, Member FDIC.Climate risks
Neighborhood: 08241
Nearby schools
GreatSchools rating
- 7/10Port Republic Elementary SchoolGrades: K-8Distance: 2 mi