$247,200
4 bd|1 ba|1.9k sqft
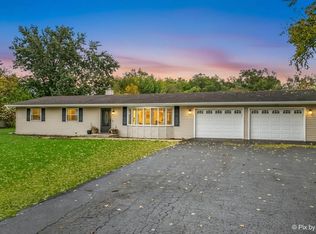
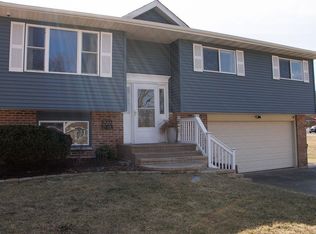
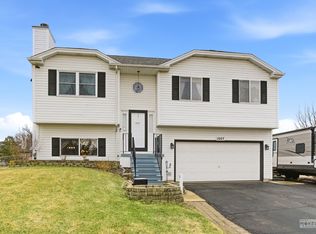
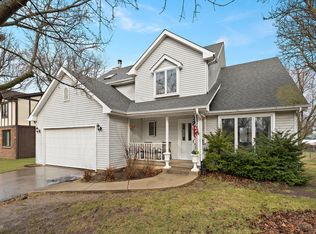
6312 Main St, Union, IL 60180
Off Market
Zillow last checked: 7 hours ago
Listing updated: February 13, 2026 at 12:02am
Angela Pop 224-392-5835,
Core Realty & Investments Inc.
Not available
Estimated sales range
Not available
Not available
| Date | Event | Price |
|---|---|---|
| 2/10/2026 | Listed for sale | $339,900$166/sqft |
Source: | ||
| 2/4/2026 | Listing removed | $339,900$166/sqft |
Source: | ||
| 11/20/2025 | Price change | $339,900-2.9%$166/sqft |
Source: | ||
| 10/24/2025 | Listed for sale | $349,900+25.4%$171/sqft |
Source: | ||
| 4/11/2025 | Sold | $279,000-0.4%$136/sqft |
Source: | ||
| 3/4/2025 | Contingent | $279,999$137/sqft |
Source: | ||
| 2/27/2025 | Listed for sale | $279,999$137/sqft |
Source: | ||
| 1/27/2025 | Contingent | $279,999$137/sqft |
Source: | ||
| 1/21/2025 | Price change | $279,999-3.4%$137/sqft |
Source: | ||
| 12/3/2024 | Listed for sale | $290,000+81.4%$141/sqft |
Source: | ||
| 4/18/2020 | Listing removed | $159,900$78/sqft |
Source: RE/MAX Connections II #10645573 Report a problem | ||
| 4/18/2020 | Listed for sale | $159,900-0.7%$78/sqft |
Source: RE/MAX Connections II #10645573 Report a problem | ||
| 4/17/2020 | Sold | $161,100+0.8%$79/sqft |
Source: | ||
| 2/28/2020 | Pending sale | $159,900$78/sqft |
Source: RE/MAX Connections II #10645573 Report a problem | ||
| 2/24/2020 | Listed for sale | $159,900$78/sqft |
Source: RE/MAX Connections II #10645573 Report a problem | ||
| Year | Property taxes | Tax assessment |
|---|---|---|
| 2024 | $5,005 +1.9% | $84,533 +10.6% |
| 2023 | $4,911 +7.3% | $76,445 +16.5% |
| 2022 | $4,576 +3.4% | $65,643 +6.1% |
| 2021 | $4,427 -0.2% | $61,898 +2.7% |
| 2020 | $4,436 | $60,300 +4.5% |
| 2019 | -- | $57,693 +11.1% |
| 2018 | $4,261 +1.8% | $51,945 +3.6% |
| 2017 | $4,184 +0.9% | $50,135 +4% |
| 2016 | $4,147 | $48,225 +6.1% |
| 2013 | $4,147 | $45,434 -9.7% |
| 2011 | -- | $50,290 -11.9% |
| 2010 | -- | $57,075 -9.5% |
| 2009 | -- | $63,066 -1.8% |
| 2008 | -- | $64,222 +6.9% |
| 2006 | -- | $60,089 +9.1% |
| 2005 | $3,047 +1.7% | $55,097 +4.9% |
| 2004 | $2,996 +4.2% | $52,533 +9.6% |
| 2003 | $2,876 +3.4% | $47,945 +5.3% |
| 2002 | $2,781 +4.7% | $45,545 +6.8% |
| 2001 | $2,657 +11.3% | $42,650 +2.3% |
| 2000 | $2,388 | $41,711 |
Find assessor info on the county website
Source: MRED as distributed by MLS GRID. This data may not be complete. We recommend contacting the local school district to confirm school assignments for this home.