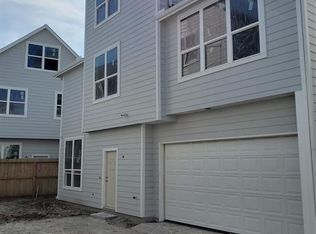
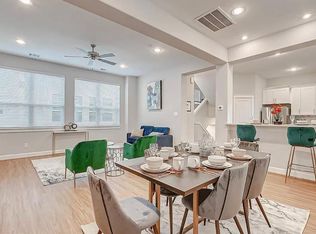
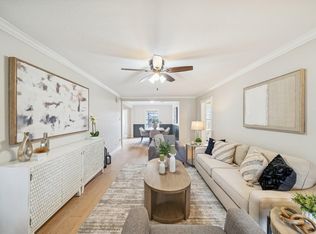
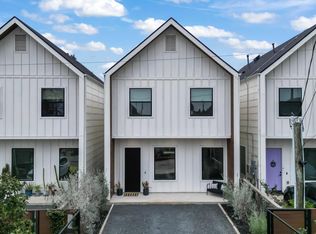
This 1897 square foot single family home has 3 bedrooms and 3.5 bathrooms. This home is located at 623 Link Rd, Houston, TX 77009.
Foreclosed
Est. $386,600
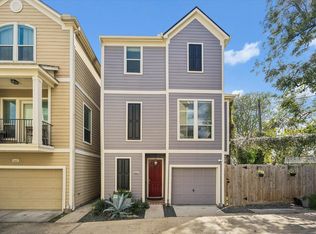
623 Link Rd, Houston, TX 77009
3beds
3baths
1,897sqft
SingleFamily
Built in 2020
1,829 Square Feet Lot
$386,600 Zestimate®
$204/sqft
$-- HOA
Overview
- 326 days |
- 216 |
- 26 |
Facts & features
Interior
Bedrooms & bathrooms
- Bedrooms: 3
- Bathrooms: 3.5
Heating
- Forced air, Gas
Cooling
- Other
Appliances
- Included: Dishwasher, Dryer, Garbage disposal, Microwave, Refrigerator, Washer
- Laundry: Hookups
Features
- Flooring: Tile
Interior area
- Total interior livable area: 1,897 sqft
Property
Parking
- Total spaces: 2
- Parking features: Garage - Attached
Features
- Exterior features: Cement / Concrete
Lot
- Size: 1,829 Square Feet
Details
- Parcel number: 1305000010017
Construction
Type & style
- Home type: SingleFamily
Materials
- Frame
- Foundation: Slab
Condition
- Year built: 2020
Community & HOA
Location
- Region: Houston
Financial & listing details
- Price per square foot: $204/sqft
- Tax assessed value: $465,131
Visit our professional directory to find a foreclosure specialist in your area that can help with your home search.
Find a foreclosure agentForeclosure details
Estimated market value
$386,600
$348,000 - $429,000
$2,567/mo
Price history
Price history
| Date | Event | Price |
|---|---|---|
| 2/17/2026 | Listing removed | $2,600$1/sqft |
Source: | ||
| 1/31/2026 | Listed for rent | $2,600$1/sqft |
Source: | ||
| 1/31/2026 | Listing removed | $2,600$1/sqft |
Source: | ||
| 12/30/2025 | Price change | $2,600-1.9%$1/sqft |
Source: | ||
| 12/12/2025 | Price change | $2,650-1.9%$1/sqft |
Source: | ||
| 10/16/2025 | Price change | $2,700-3.6%$1/sqft |
Source: | ||
| 10/14/2025 | Price change | $2,800-1.8%$1/sqft |
Source: | ||
| 10/1/2025 | Listed for rent | $2,850+1.8%$2/sqft |
Source: | ||
| 4/15/2025 | Sold | -- |
Source: Public Record Report a problem | ||
| 6/20/2024 | Listing removed | -- |
Source: | ||
| 4/11/2024 | Listed for rent | $2,800$1/sqft |
Source: | ||
| 1/5/2024 | Listing removed | -- |
Source: | ||
| 12/7/2023 | Price change | $2,800-3.4%$1/sqft |
Source: | ||
| 10/2/2023 | Price change | $2,900-1.7%$2/sqft |
Source: | ||
| 9/14/2023 | Price change | $2,950-7.8%$2/sqft |
Source: | ||
| 7/22/2023 | Listed for rent | $3,200+18.5%$2/sqft |
Source: | ||
| 9/24/2022 | Listing removed | -- |
Source: Zillow Rental Manager Report a problem | ||
| 8/3/2022 | Price change | $2,700-3.6%$1/sqft |
Source: Zillow Rental Manager Report a problem | ||
| 7/18/2022 | Price change | $2,800-3.4%$1/sqft |
Source: Zillow Rental Manager Report a problem | ||
| 7/12/2022 | Listed for rent | $2,900$2/sqft |
Source: Zillow Rental Manager Report a problem | ||
| 12/20/2021 | Sold | -- |
Source: Agent Provided Report a problem | ||
| 12/20/2021 | Price change | $380,000-1.3%$200/sqft |
Source: | ||
| 11/18/2021 | Pending sale | $384,900$203/sqft |
Source: | ||
| 10/26/2021 | Listed for sale | $384,900$203/sqft |
Source: | ||
Public tax history
Public tax history
| Year | Property taxes | Tax assessment |
|---|---|---|
| 2025 | -- | $465,131 +1.8% |
| 2024 | $9,558 +4.5% | $456,820 +0.6% |
| 2023 | $9,149 -1% | $454,093 +8.2% |
| 2022 | $9,239 | $419,610 +283.9% |
| 2021 | -- | $109,304 +20.7% |
| 2020 | -- | $90,550 +66.6% |
| 2019 | $1,316 -36.1% | $54,360 -33.3% |
| 2018 | $2,059 | $81,495 |
| 2017 | $2,059 +124.8% | $81,495 +125% |
| 2016 | $916 -22.5% | $36,227 -56.1% |
| 2015 | $1,182 | $82,582 +33.3% |
| 2014 | $1,182 | $61,936 |
| 2011 | -- | $61,936 |
| 2009 | -- | -- |
Find assessor info on the county website
BuyAbility℠ payment
Estimated monthly payment
Boost your down payment with 6% savings match
Earn up to a 6% match & get a competitive APY with a *. Zillow has partnered with to help get you home faster.
Learn more*Terms apply. Match provided by Foyer. Account offered by Pacific West Bank, Member FDIC.Climate risks
Neighborhood: Greater Heights
Getting around
55 / 100
Good TransitNearby schools
GreatSchools rating
- 5/10Jefferson Elementary SchoolGrades: PK-5Distance: 0.6 mi
- 6/10Hamilton Middle SchoolGrades: 6-8Distance: 1.1 mi
- 6/10Heights High SchoolGrades: 9-12Distance: 1.2 mi