$224,300
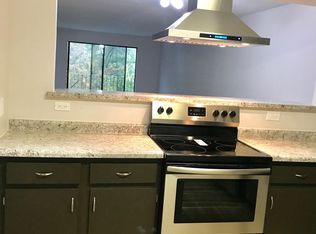
2 bd|2 ba|1.2k sqft
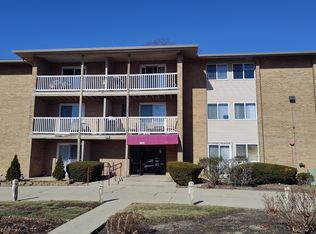
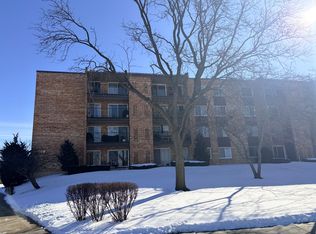
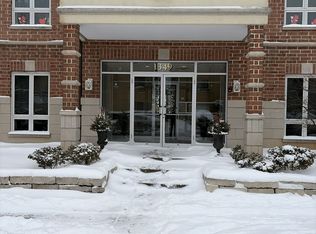
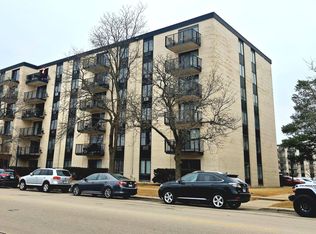
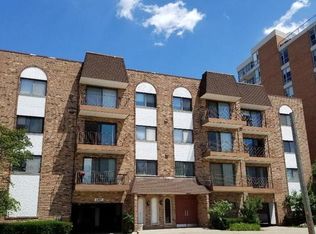
603 S River Rd APT 1B, Des Plaines, IL 60016
Off Market
Zillow last checked: 8 hours ago
Listing updated: December 19, 2025 at 01:08pm
Chinedum Ibe 847-594-1608,
PMI Metro & Suburban
$236,800
$225,000 - $249,000
$1,960/mo
| Date | Event | Price |
|---|---|---|
| 12/19/2025 | Listed for sale | $245,000+44.1%$204/sqft |
Source: | ||
| 8/16/2022 | Listing removed | -- |
Source: Zillow Rental Network Premium Report a problem | ||
| 8/3/2022 | Listed for rent | $1,650+14.2%$1/sqft |
Source: Zillow Rental Network Premium Report a problem | ||
| 3/3/2018 | Listing removed | $1,445$1/sqft |
Source: Fundamental Property Management Inc. Report a problem | ||
| 2/16/2018 | Listed for rent | $1,445+3.6%$1/sqft |
Source: Fundamental Property Management Inc. Report a problem | ||
| 10/14/2017 | Listing removed | $1,395$1/sqft |
Source: Fundamental Property Management Inc. Report a problem | ||
| 9/26/2017 | Listed for rent | $1,395$1/sqft |
Source: Fundamental Property Management Inc. Report a problem | ||
| 1/2/2008 | Sold | $170,000+44.7%$142/sqft |
Source: | ||
| 4/29/1999 | Sold | $117,500$98/sqft |
Source: Public Record Report a problem | ||
| Year | Property taxes | Tax assessment |
|---|---|---|
| 2023 | $4,136 +2.5% | $15,686 |
| 2022 | $4,036 +23% | $15,686 +47% |
| 2021 | $3,280 +1.7% | $10,672 |
| 2020 | $3,225 +0.7% | $10,672 -10.3% |
| 2019 | $3,202 +3.8% | $11,900 +15.3% |
| 2018 | $3,085 +1.8% | $10,317 |
| 2017 | $3,031 +5.7% | $10,317 |
| 2016 | $2,867 -32.8% | $10,317 -26.9% |
| 2015 | $4,265 +24.7% | $14,108 -0.1% |
| 2014 | $3,419 +3.1% | $14,122 |
| 2013 | $3,316 +13.9% | $14,122 +0.5% |
| 2012 | $2,911 +0.6% | $14,054 |
| 2011 | $2,892 -0.4% | $14,054 |
| 2010 | $2,902 +2.7% | $14,054 -17.4% |
| 2009 | $2,827 +12.4% | $17,021 -12% |
| 2008 | $2,515 -28.7% | $19,341 |
| 2007 | $3,530 +64.2% | $19,341 +30.9% |
| 2006 | $2,149 +10.3% | $14,778 |
| 2005 | $1,949 +4.8% | $14,778 |
| 2004 | $1,859 -11.6% | $14,778 +25.6% |
| 2003 | $2,103 +3% | $11,764 |
| 2002 | $2,040 +28.8% | $11,764 |
| 2001 | $1,585 +97.9% | $11,764 +8.4% |
| 2000 | $801 -5.8% | $10,851 |
| 1999 | $851 | $10,851 |
Find assessor info on the county website
Source: MRED as distributed by MLS GRID. This data may not be complete. We recommend contacting the local school district to confirm school assignments for this home.