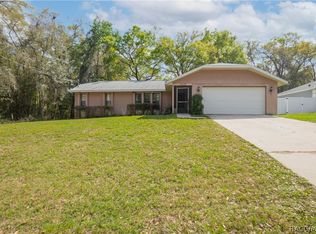
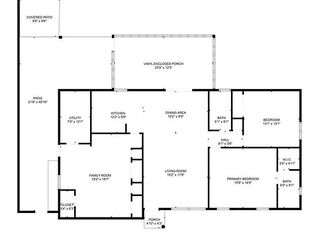
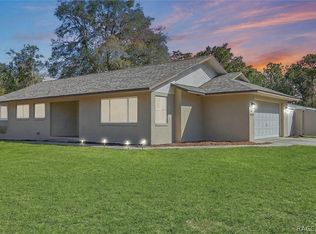
Enjoy Florida living with this 2/2/2 pool home located in Inverness Highlands West. You'll spend most of the day enjoying the glassed in Florida room overlooking the pool. The large, SOLAR HEATED, 16x32 caged pool is for your relaxation or exercise, and there is a large covered lanai to shade you from the sun. The kitchen has a breakfast nook, and there is also a dining area next to the living area, giving the home an open and airy feel. A newer roof and AC system give you peace of mind for years to come.
Pre-foreclosure
Est. $235,100
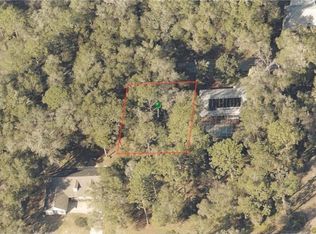
6006 E Seneca St, Inverness, FL 34452
2beds
1,738sqft
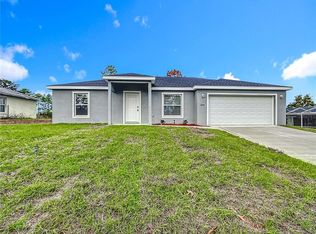
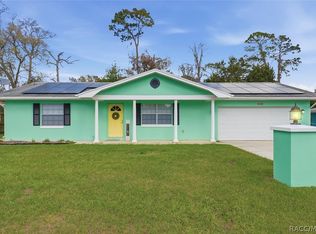
SingleFamily
Built in 1972
9,583 Square Feet Lot
$235,100 Zestimate®
$135/sqft
$-- HOA
Overview
- 142 days |
- 47 |
- 5 |
Facts & features
Interior
Bedrooms & bathrooms
- Bedrooms: 2
- Bathrooms: 2
- Full bathrooms: 2
Heating
- Heat pump, Electric
Cooling
- Central
Appliances
- Included: Dishwasher, Dryer, Range / Oven, Refrigerator, Washer
Features
- Flooring: Tile, Carpet
Interior area
- Total interior livable area: 1,738 sqft
Property
Parking
- Parking features: Garage - Attached
Features
- Exterior features: Stucco, Brick, Cement / Concrete
Lot
- Size: 9,583 Square Feet
Details
- Parcel number: 20E19S290010040400050
Construction
Type & style
- Home type: SingleFamily
Materials
- Concrete Block
- Foundation: Footing
- Roof: Asphalt
Condition
- Year built: 1972
Community & HOA
Location
- Region: Inverness
Financial & listing details
- Price per square foot: $135/sqft
- Tax assessed value: $177,445
- Annual tax amount: $2,796
Visit our professional directory to find a foreclosure specialist in your area that can help with your home search.
Find a foreclosure agentForeclosure details
Estimated market value
$235,100
$219,000 - $252,000
$2,140/mo
Price history
Price history
| Date | Event | Price |
|---|---|---|
| 7/11/2024 | Listing removed | $265,000$152/sqft |
Source: | ||
| 3/19/2024 | Listing removed | -- |
Source: | ||
| 2/1/2024 | Listed for sale | $265,000+28%$152/sqft |
Source: | ||
| 10/5/2022 | Sold | $207,000+1%$119/sqft |
Source: | ||
| 8/20/2022 | Pending sale | $205,000$118/sqft |
Source: | ||
| 8/17/2022 | Listed for sale | $205,000+133%$118/sqft |
Source: | ||
| 7/14/2016 | Sold | $88,000-2.1%$51/sqft |
Source: | ||
| 5/4/2016 | Pending sale | $89,900$52/sqft |
Source: CENTURY 21 J W Morton Real Estate, Inc. #724999 Report a problem | ||
| 4/20/2016 | Price change | $89,900-5.4%$52/sqft |
Source: CENTURY 21 J W Morton Real Estate, Inc. #724999 Report a problem | ||
| 3/6/2016 | Listed for sale | $95,000$55/sqft |
Source: Century 21, J.W. Morton #724999 Report a problem | ||
Public tax history
Public tax history
| Year | Property taxes | Tax assessment |
|---|---|---|
| 2024 | $2,796 +2% | $177,445 +3.2% |
| 2023 | $2,741 +266.4% | $172,022 +111.4% |
| 2022 | $748 +4.4% | $81,357 +3% |
| 2021 | $717 +10.2% | $78,987 +1.4% |
| 2020 | $650 +2.4% | $77,896 +2.3% |
| 2019 | $635 +3.7% | $76,145 +1.9% |
| 2018 | $613 | $74,725 +2.1% |
| 2017 | $613 -0.7% | $73,188 +34.1% |
| 2016 | $617 +22.6% | $54,586 +0.7% |
| 2015 | $504 -0.7% | $54,207 -4.3% |
| 2014 | $507 +2.8% | $56,640 +0.9% |
| 2013 | $493 +6.3% | $56,140 -1.5% |
| 2012 | $464 -10% | $57,010 -9.4% |
| 2011 | $516 +3.5% | $62,901 +1.5% |
| 2010 | $498 -5.6% | $61,972 -2.4% |
| 2009 | $528 +1.2% | $63,512 +0.1% |
| 2008 | $522 -11.8% | $63,448 +3% |
| 2007 | $592 +0.3% | $61,600 +2.5% |
| 2006 | $590 -4.3% | $60,100 +2.9% |
| 2005 | $617 +0.9% | $58,400 +3% |
| 2004 | $611 +6.4% | $56,700 +1.8% |
| 2003 | $574 +7.5% | $55,700 +2.4% |
| 2002 | $534 +5.7% | $54,400 +4.4% |
| 2000 | $505 | $52,100 |
Find assessor info on the county website
Monthly payment
Estimated monthly payment
All calculations are estimates and provided by Zillow, Inc. for informational purposes only. Actual amounts may vary.
HOA fees may include property taxes on listings classified as Co-Ops. Contact the listing agent and/or owner for fee details.
Mortgage interest rates are dependent on a number of factors, including credit score, down payment, and repayment length. Interest rate data provided by Zillow Group Marketplace, Inc. as of 1/1/1970 from various mortgage lenders with which we have lead or other similar arrangements; the Estimated Payment is an average of those rates.
See how much you could borrow to make a competitive offer.
Climate risks
Neighborhood: 34452
Nearby schools
GreatSchools rating
- 6/10Pleasant Grove Elementary SchoolGrades: PK-5Distance: 2.5 mi
- NACitrus Virtual Instruction ProgramGrades: K-12Distance: 3.2 mi
- 4/10Citrus High SchoolGrades: 9-12Distance: 3.1 mi

- Florida
- Citrus County
- Inverness
- 34452
- 6006 E Seneca St
Nearby cities
Nearby neighborhoods
Nearby zip codes
Other Inverness Topics
