$--
3 bd|1 ba|1k sqft
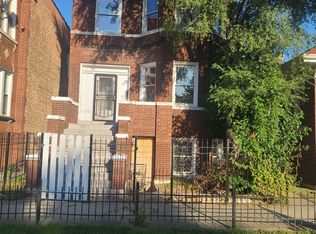
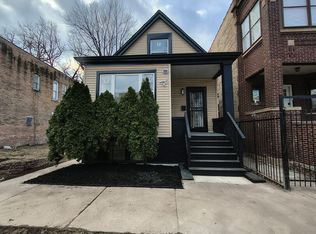
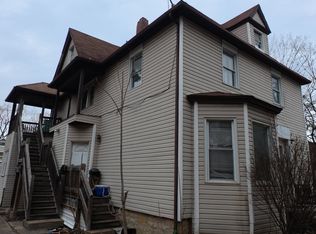
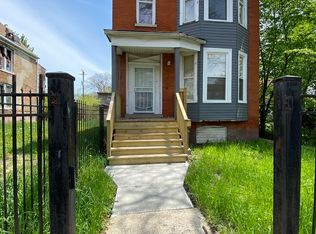
5641 S Morgan St #2, Chicago, IL 60621
Off Market
Zillow last checked: 7 hours ago
Listing updated: February 09, 2026 at 09:26am
Emory Brown 708-932-6866,
TADD Realty
Not available
Estimated sales range
Not available
Not available
| Date | Event | Price |
|---|---|---|
| 1/26/2026 | Listed for sale | $260,000 |
Source: | ||
| 1/8/2026 | Contingent | $260,000 |
Source: | ||
| 11/4/2025 | Listed for sale | $260,000 |
Source: | ||
| 10/7/2025 | Listing removed | $260,000 |
Source: | ||
| 8/9/2025 | Listed for sale | $260,000 |
Source: | ||
| 8/2/2025 | Listing removed | $260,000 |
Source: | ||
| 11/5/2024 | Listed for sale | $260,000-14.8% |
Source: | ||
| 8/18/2024 | Listing removed | $305,000 |
Source: | ||
| 7/30/2024 | Listed for sale | $305,000+64.9% |
Source: | ||
| 6/1/2022 | Sold | $185,000-5.6% |
Source: | ||
| 4/1/2022 | Pending sale | $195,900 |
Source: | ||
| 11/11/2021 | Listed for sale | $195,900+335.3% |
Source: | ||
| 10/7/2019 | Sold | $45,000-9.8% |
Source: | ||
| 8/18/2019 | Pending sale | $49,900 |
Source: Keller Williams Elite #10405309 Report a problem | ||
| 7/31/2019 | Price change | $49,900-9.1% |
Source: Keller Williams Elite #10405309 Report a problem | ||
| 7/15/2019 | Price change | $54,900-8.3% |
Source: Keller Williams Elite #10405309 Report a problem | ||
| 6/6/2019 | Listed for sale | $59,900+71.1% |
Source: Keller Williams Elite #10405309 Report a problem | ||
| 5/13/2017 | Listing removed | $1,050 |
Source: Go Section8 Report a problem | ||
| 5/12/2017 | Listed for rent | $1,050 |
Source: Go Section8 Report a problem | ||
| 12/9/2016 | Sold | $35,000-22.2% |
Source: Public Record Report a problem | ||
| 11/14/2016 | Pending sale | $45,000 |
Source: Select a Fee RE System #09354467 Report a problem | ||
| 9/29/2016 | Price change | $45,000+12.5% |
Source: Select a Fee RE System #09354467 Report a problem | ||
| 1/30/2016 | Price change | $40,000+14.3% |
Source: Owner Report a problem | ||
| 1/21/2016 | Listed for sale | $35,000+52.2% |
Source: Owner Report a problem | ||
| 1/15/2015 | Sold | $23,000-23.1% |
Source: Public Record Report a problem | ||
| 12/8/2014 | Listed for sale | $29,900-89.1% |
Source: Owner Report a problem | ||
| 9/4/2009 | Sold | $275,000+17% |
Source: Public Record Report a problem | ||
| 11/1/2004 | Sold | $235,000+308.7% |
Source: Public Record Report a problem | ||
| 6/9/2004 | Sold | $57,500 |
Source: Public Record Report a problem | ||
| Year | Property taxes | Tax assessment |
|---|---|---|
| 2023 | $844 +2.6% | $4,000 |
| 2022 | $823 +2.3% | $4,000 |
| 2021 | $804 -46.1% | $4,000 -40.3% |
| 2020 | $1,492 -3.5% | $6,697 -13% |
| 2019 | $1,547 +1.7% | $7,698 |
| 2018 | $1,521 -44.8% | $7,698 -39.9% |
| 2017 | $2,756 +7.5% | $12,803 |
| 2016 | $2,564 +9.3% | $12,803 |
| 2015 | $2,346 +0.4% | $12,803 +1.6% |
| 2014 | $2,338 +2% | $12,599 |
| 2013 | $2,291 +1.4% | $12,599 |
| 2012 | $2,261 -12.4% | $12,599 -20.9% |
| 2011 | $2,581 -0.4% | $15,925 |
| 2010 | $2,591 +4.4% | $15,925 |
| 2009 | $2,483 -10.6% | $15,925 -17.8% |
| 2008 | $2,778 +1% | $19,364 |
| 2007 | $2,750 -1.1% | $19,364 |
| 2006 | $2,780 +139.1% | $19,364 +172.2% |
| 2005 | $1,163 +1% | $7,115 |
| 2004 | $1,151 +2.2% | $7,115 |
| 2003 | $1,126 +26% | $7,115 +43% |
| 2002 | $894 +74.9% | $4,974 |
| 2001 | $511 -13.7% | $4,974 |
| 2000 | $592 | $4,974 +61.4% |
| 1999 | $592 | $3,082 |
Find assessor info on the county website
Source: MRED as distributed by MLS GRID. This data may not be complete. We recommend contacting the local school district to confirm school assignments for this home.