$33,050
2 bd|1 ba|1.1k sqft
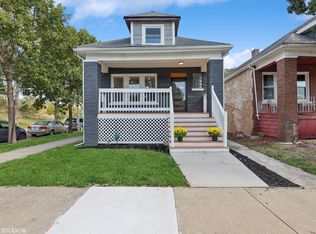
5632 S Carpenter St, Chicago, IL 60621
Off Market
Zillow last checked: 7 hours ago
Listing updated: January 31, 2026 at 11:33am
Jeannie Pezan 719-213-1100,
Coldwell Banker Real Estate Group
$270,200
$257,000 - $284,000
$2,518/mo
| Date | Event | Price |
|---|---|---|
| 1/31/2026 | Contingent | $269,999$165/sqft |
Source: | ||
| 1/14/2026 | Listed for sale | $269,999-1.8%$165/sqft |
Source: | ||
| 1/14/2026 | Listing removed | $274,999$168/sqft |
Source: | ||
| 11/13/2025 | Price change | $274,9990%$168/sqft |
Source: | ||
| 10/16/2025 | Listed for sale | $275,000-5.1%$168/sqft |
Source: | ||
| 10/16/2025 | Listing removed | $289,900$177/sqft |
Source: | ||
| 9/18/2025 | Price change | $289,900-1.7%$177/sqft |
Source: | ||
| 9/3/2025 | Listed for sale | $295,000+340.3%$180/sqft |
Source: | ||
| 8/31/2023 | Sold | $67,000-16.1%$41/sqft |
Source: | ||
| 8/11/2023 | Contingent | $79,900$49/sqft |
Source: | ||
| 7/14/2023 | Price change | $79,900-6%$49/sqft |
Source: | ||
| 6/12/2023 | Listed for sale | $85,000+165.6%$52/sqft |
Source: | ||
| 6/13/2017 | Sold | $32,000-17.9%$20/sqft |
Source: | ||
| 5/6/2017 | Pending sale | $39,000$24/sqft |
Source: Internet Real Estate, LTD. #09571484 Report a problem | ||
| 3/22/2017 | Listed for sale | $39,000+310.5%$24/sqft |
Source: Internet Real Estate, LTD. #09571484 Report a problem | ||
| 5/27/2015 | Listing removed | $1,372$1/sqft |
Source: Go Section8 Report a problem | ||
| 5/9/2015 | Listed for rent | $1,372+3.2%$1/sqft |
Source: Go Section8 Report a problem | ||
| 4/18/2014 | Listing removed | $1,330$1/sqft |
Source: Postlets Report a problem | ||
| 3/18/2014 | Listed for rent | $1,330$1/sqft |
Source: Postlets Report a problem | ||
| 5/5/2011 | Sold | $9,500$6/sqft |
Source: Public Record Report a problem | ||
| Year | Property taxes | Tax assessment |
|---|---|---|
| 2023 | $738 +2.6% | $3,499 |
| 2022 | $720 +2.3% | $3,499 |
| 2021 | $704 -46.9% | $3,499 -41.2% |
| 2020 | $1,326 -1.3% | $5,951 -11% |
| 2019 | $1,343 +1.7% | $6,687 |
| 2018 | $1,321 -28.6% | $6,687 -22.1% |
| 2017 | $1,849 +7.5% | $8,588 |
| 2016 | $1,720 +9.3% | $8,588 |
| 2015 | $1,574 +2.3% | $8,588 +3.6% |
| 2014 | $1,538 +2% | $8,289 |
| 2013 | $1,508 +1.4% | $8,289 |
| 2012 | $1,487 -7.9% | $8,289 -16.8% |
| 2011 | $1,615 -0.4% | $9,966 |
| 2010 | $1,622 +4.4% | $9,966 |
| 2009 | $1,554 -9.7% | $9,966 -17% |
| 2008 | $1,722 +1% | $12,002 |
| 2007 | $1,705 -1.1% | $12,002 |
| 2006 | $1,723 +95.3% | $12,002 +122.3% |
| 2005 | $882 +1% | $5,399 |
| 2004 | $873 +2.2% | $5,399 |
| 2003 | $854 +28% | $5,399 +45.3% |
| 2002 | $667 +3.8% | $3,715 |
| 2001 | $643 +226.1% | $3,715 |
| 2000 | $197 -3.8% | $3,715 +33.6% |
| 1999 | $205 | $2,780 |
Find assessor info on the county website
Source: MRED as distributed by MLS GRID. This data may not be complete. We recommend contacting the local school district to confirm school assignments for this home.