$--
3 bd|1 ba|-- sqft
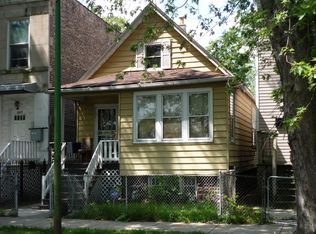
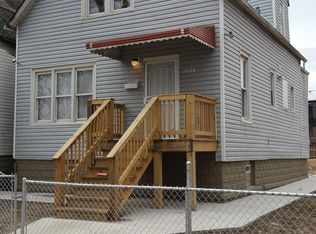
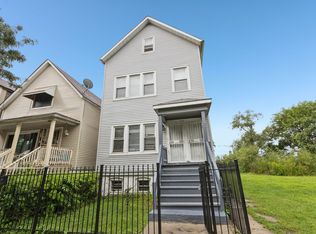
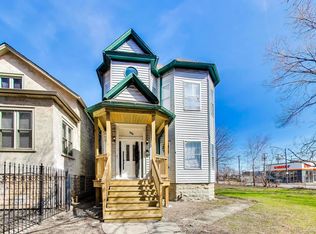
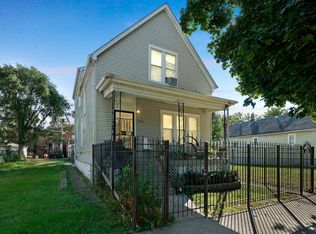
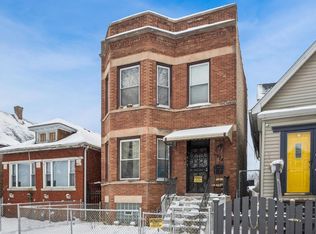
5624 S Lowe Ave #1, Chicago, IL 60621
Off Market

Zillow last checked: 7 hours ago
Listing updated: February 16, 2026 at 12:15pm
Irais Torres iraist@fultongrace.com,
Fulton Grace Realty
Not available
Estimated sales range
Not available
Not available
| Date | Event | Price |
|---|---|---|
| 2/16/2026 | Contingent | $249,999 |
Source: | ||
| 1/31/2026 | Listed for sale | $249,999+25% |
Source: | ||
| 12/22/2023 | Sold | $200,000+0.5% |
Source: | ||
| 11/7/2023 | Contingent | $199,000 |
Source: | ||
| 10/6/2023 | Price change | $199,000-4.8% |
Source: | ||
| 9/20/2023 | Listed for sale | $209,000 |
Source: | ||
| 9/19/2023 | Contingent | $209,000 |
Source: | ||
| 9/12/2023 | Price change | $209,000-8.7% |
Source: | ||
| 8/8/2023 | Listed for sale | $229,000+408.9% |
Source: | ||
| 1/4/2021 | Sold | $45,000-8.2% |
Source: Public Record Report a problem | ||
| 6/26/2020 | Sold | $49,000-10.9% |
Source: | ||
| 5/19/2020 | Pending sale | $55,000 |
Source: Chicago Realty Partners Ltd #10703062 Report a problem | ||
| 5/1/2020 | Listed for sale | $55,000-77.1% |
Source: Chicago Realty Partners Ltd #10703062 Report a problem | ||
| 6/4/2012 | Sold | $240,000+1100% |
Source: Public Record Report a problem | ||
| 6/25/2010 | Sold | $20,000-81% |
Source: Public Record Report a problem | ||
| 4/2/2008 | Sold | $105,000+110% |
Source: Public Record Report a problem | ||
| 2/27/2008 | Sold | $50,000 |
Source: Public Record Report a problem | ||
| Year | Property taxes | Tax assessment |
|---|---|---|
| 2023 | $706 +2.6% | $3,345 |
| 2022 | $688 +2.3% | $3,345 |
| 2021 | $673 -65.8% | $3,345 -62.1% |
| 2020 | $1,966 -3.5% | $8,827 -13% |
| 2019 | $2,038 +1.7% | $10,146 |
| 2018 | $2,004 -28.3% | $10,146 -21.8% |
| 2017 | $2,794 +7.5% | $12,981 |
| 2016 | $2,600 +9.3% | $12,981 |
| 2015 | $2,379 +23.3% | $12,981 +24.9% |
| 2014 | $1,929 +2% | $10,394 |
| 2013 | $1,890 +1.4% | $10,394 |
| 2012 | $1,865 -10.1% | $10,394 -18.8% |
| 2011 | $2,074 -0.4% | $12,800 |
| 2010 | $2,083 +4.4% | $12,800 |
| 2009 | $1,996 -26.6% | $12,800 -32.4% |
| 2008 | $2,718 +1% | $18,945 |
| 2007 | $2,691 -1.1% | $18,945 |
| 2006 | $2,720 +96.6% | $18,945 +123.8% |
| 2005 | $1,384 +1% | $8,467 |
| 2004 | $1,370 +2.2% | $8,467 |
| 2003 | $1,340 +86.2% | $8,467 +111.4% |
| 2002 | $720 +3.8% | $4,005 |
| 2001 | $694 +27.5% | $4,005 |
| 2000 | $544 -0.7% | $4,005 +41.4% |
| 1999 | $548 | $2,832 |
Find assessor info on the county website
Source: MRED as distributed by MLS GRID. This data may not be complete. We recommend contacting the local school district to confirm school assignments for this home.